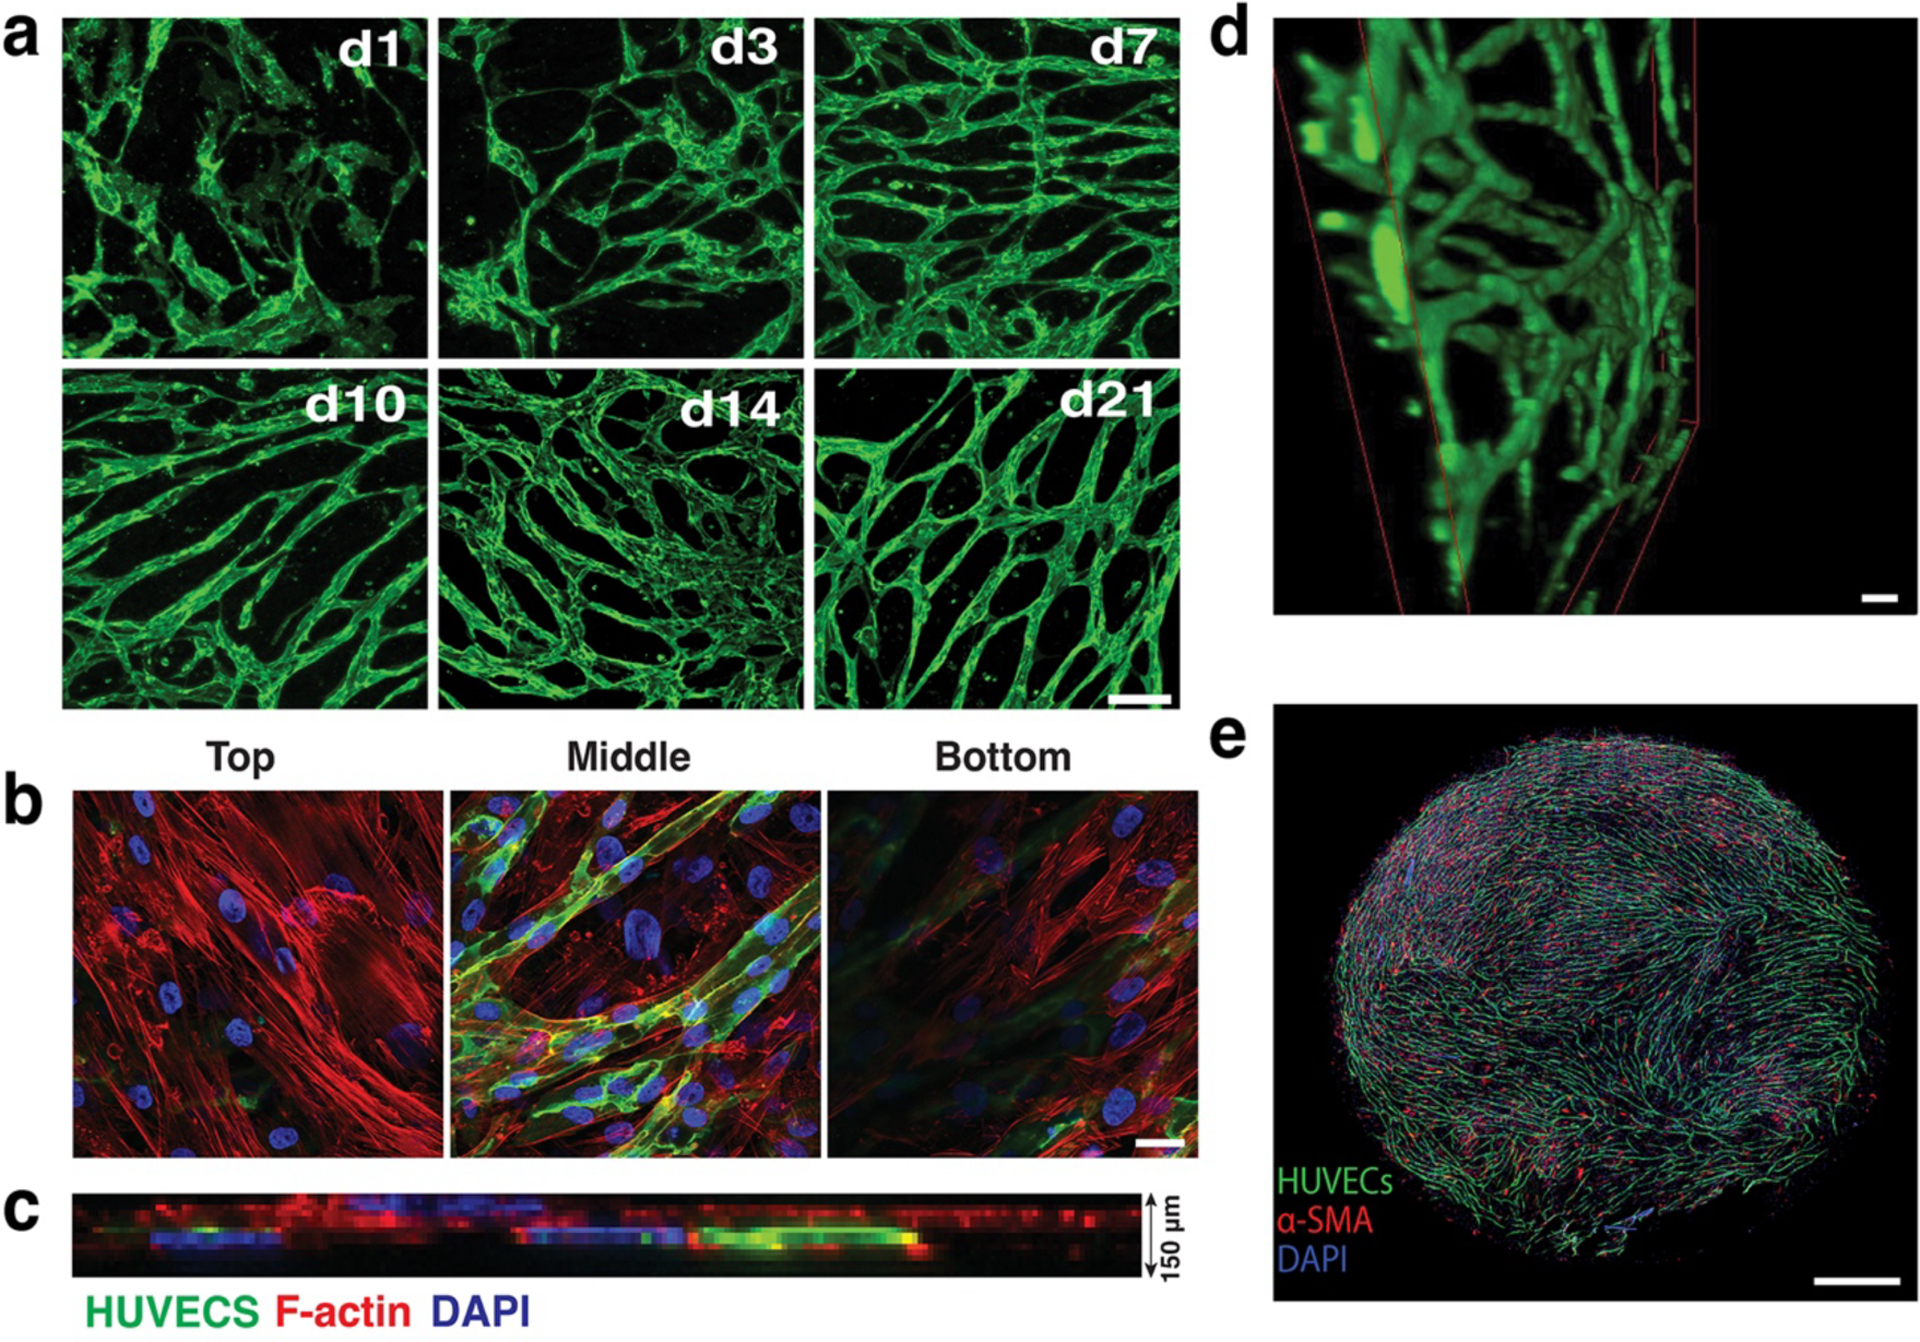
Fig. 1: In vitro vascularization.

a) Co-culturing HUVECs (green) with SMCs (not shown here for clarity) leads to the formation of an interconnected vessel network by day 21. Scale bar, 200 μm.
b) Co-cultures (shown at Day 7 in culture) form a multi-layered tissue with SMCs surrounding the HUVECs (green) are seen underneath as well as above the vessel network. F-actin of both cell populations is stained with Phalloidin-568 (red). Blue depicts nuclei stained with DAPI. Scale bar, 20 μm.
c) The thickness of the multi-layered tissue (HUVECs, SMCs and matrix) is approximately 150 μm (a side view of a confocal stack is shown).
d) 3-D reconstruction of part of an in vitro network. Scale bar, 50 μm.
e) The complete network fully covers a well of a 96-well plate (Scale bar, 800 μm).
Reproduced with permission from (9).
