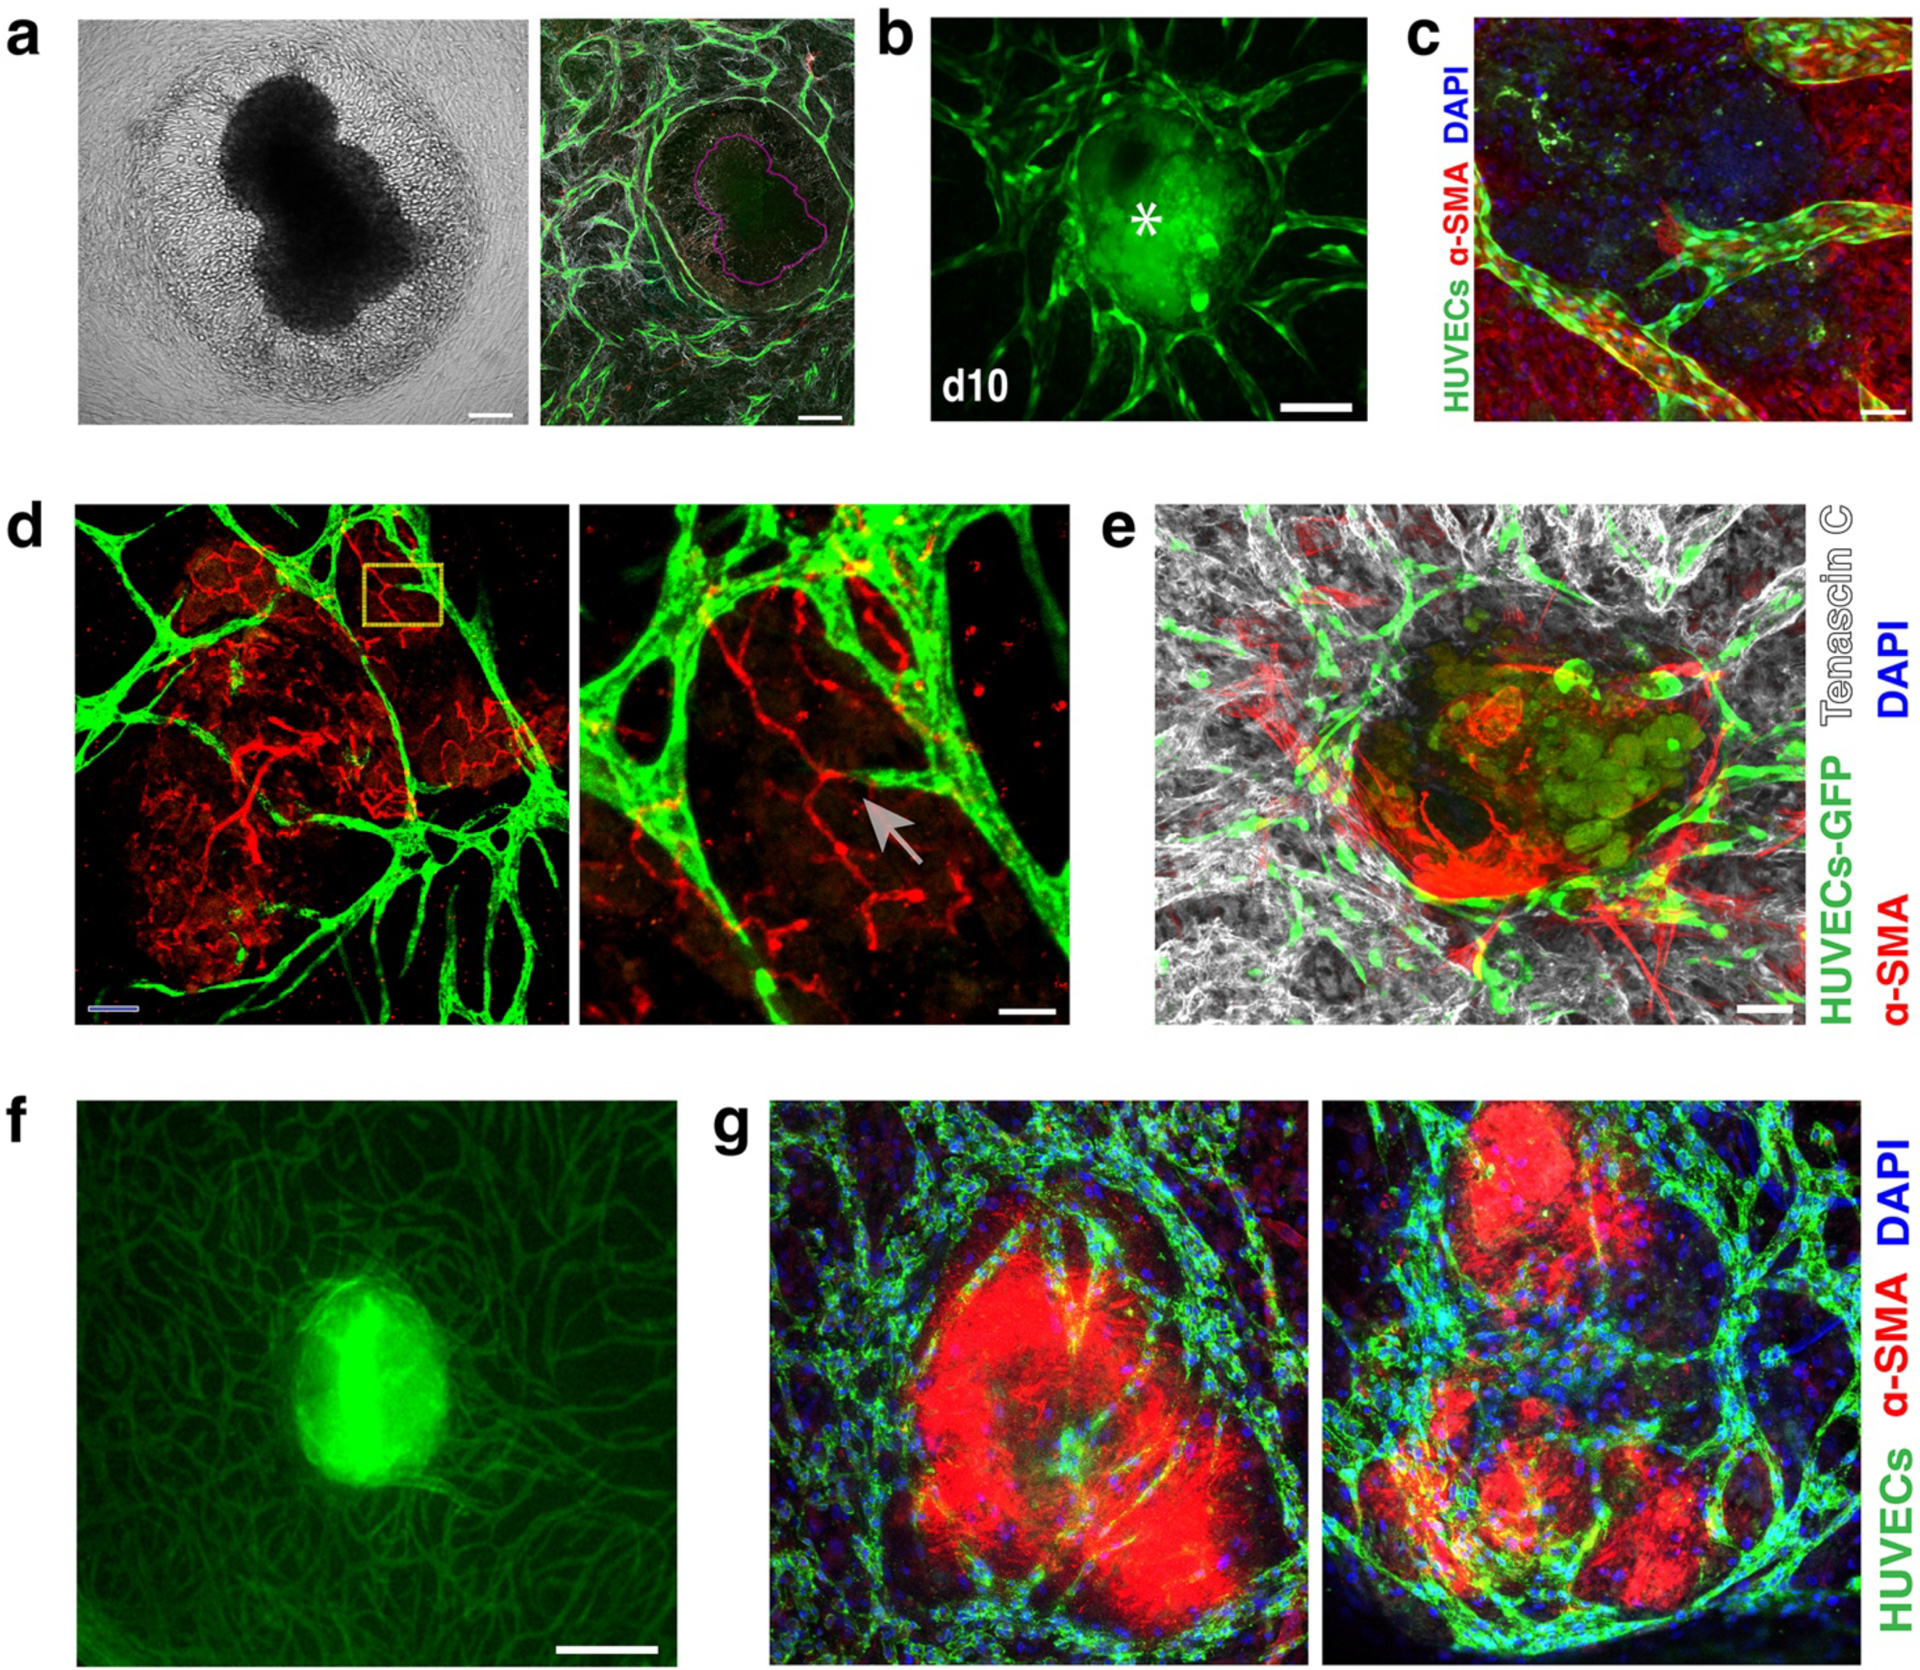
Fig. 3: VTE cultures.

a) Brightfield image showing the disruption of Mu89 tumors when placed on the EC-SMC co-culture at Day 0. The corresponding mosaic confocal image of the same tumour (purple outline) shows that the formed vessels (green) create a ‘ring’ around the Mu89 tumor explant.
b) Vascularization of PANC-1 VTEs (asterisk), showing the vessels (green) surrounding and penetrating the tumor explants (due to auto-fluorescence, the tumour explants are also shown in green) over 10 days. Scale bar, 150 μm.
c) High-resolution confocal image showing a vessel (green) with a clearly formed lumen extending into a tumor explant. Scale bar, 50 μm. Nuclei stained with DAPI (blue).
d) Vessels (green) connect with the mouse explant vessels (red). Scale bar, 50 μm. Zoomed-in yellow area shows two vessels connecting (arrow); scale bar, 25 μm.
e) Tenascin-C (grey) was strongly expressed by Mu89 VTEs ex-vivo. Scale bar, 100 μm.
f) A patient-derived pancreatic VTE on Day 7 in culture was highly vascularized in vitro. Vessels (green); Scale bar, 150 μm.
g) Two different patient-derived VTEs (which appear red due to high levels of αSMA) show significant vessel infiltration within 7 days in culture. Vessels (green), nuclei (blue, DAPI). Scale bar, 150 μm.
