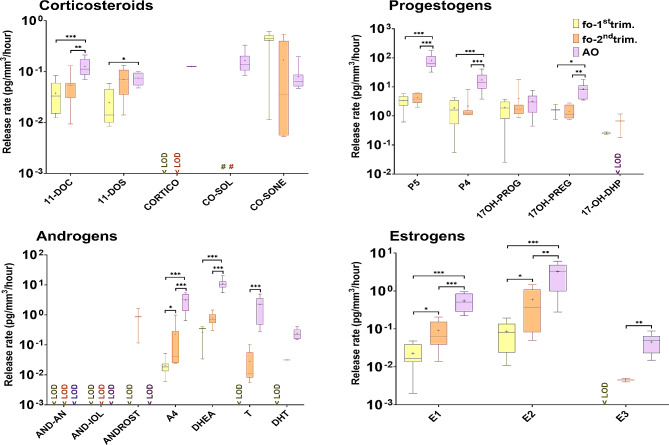
Fig. 3.
Life stage differences in the profiles of steroid hormone release rates from first (fo-1st trim.) and second (fo-2nd trim.) trimester fetal ovarian tissue cultures and adult (AO) ovarian tissue cultures. Release rates (pg/mm3/ hour) are shown on a logarithmic scale on the Y-axis. Median release rates (middle line), 25% and 75% percentiles (box borders) are shown. Mean release rates are indicated as ”+” and whiskers indicate the minimum and maximum values. N values are given in Figure S1. Statistically significant differences in steroid hormone release rates between fetal and adult ovarian cultures are shown by *(p < 0.05), **(p < 0.01) and ***(p < 0.001). < LOD, below the limit of detection.”#” used for levels of CO-SOL measured in fetal ovarian tissue cultures, which were excluded since CO-SOL was measured in the uncultured media (See in Results)

