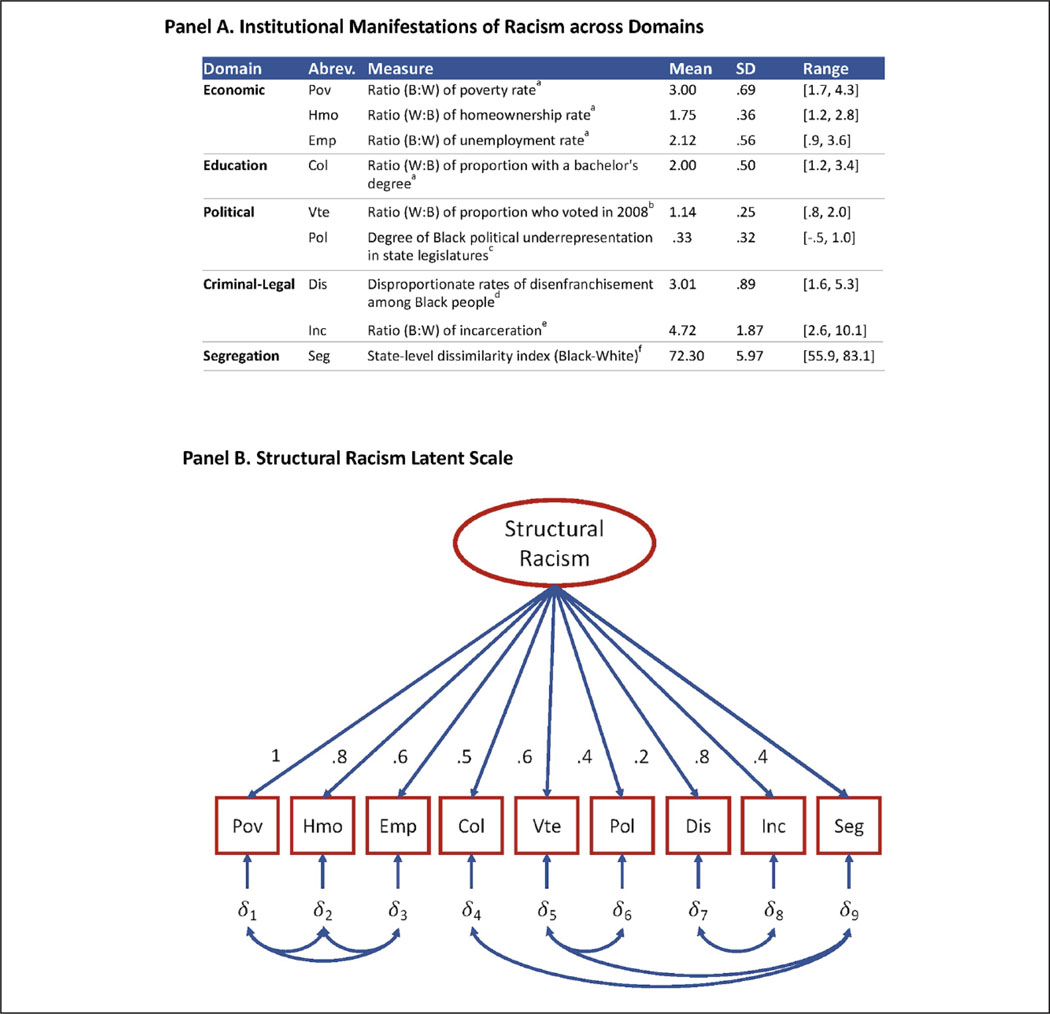
Figure 2.
The Structure of State-Level Racism.
Note: (A) Additional details on the operationalization of the indicators of racism are included in the data and methods section and Appendix B in the online version of the article.
Sources: aIpUMS Current population Survey; bU.S. census; cNational Conference on State Legislatures; dThe Sentencing project; eVera Institute of Justice; fNational Strategic planning and Analysis Research Center. (B) The diagram of the latent scale of structural racism includes factor loadings and correlated errors among state-level indicators of racism as measured by racialized patterns in poverty (pov), home ownership (Hmo), employment (Emp), bachelor’s degrees (Col), voting (Vte), political representation (pol), disenfranchisement (Dis), incarceration (Inc) and segregation (Seg). Model fit statistics: comparative fit index = .959; Tucker-Lewis index = .926, root mean square error of approximation = .076; Bayesian information criterion is negative; chi-squared is not statistically significant. Additional details on confirmatory factor analysis models assessed are included in the data and methods section and Appendix D in the online version of the article.

