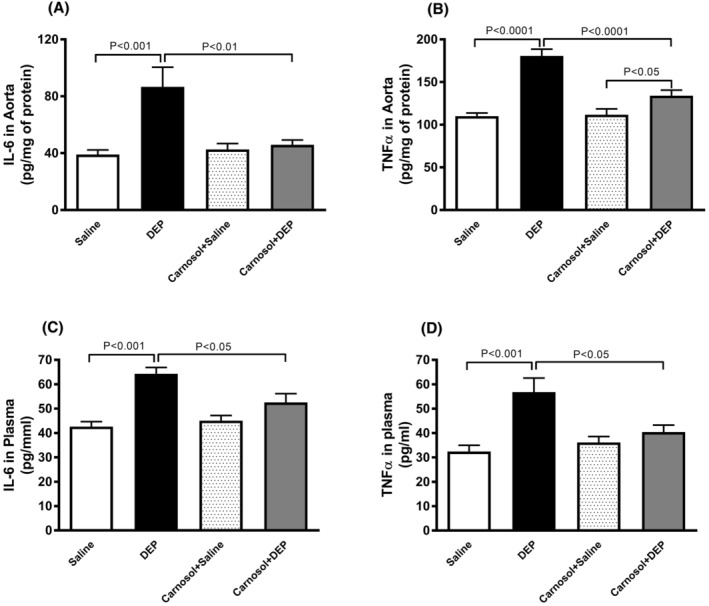
FIGURE 6.

Interleukin‐6 (IL‐6; A and C) and tumor necrosis factor α (TNFα; B and D) concentrations in aortic tissue homogenates and plasma, 24 h after pulmonary administration of either saline or diesel exhaust particles (DEP; 20 μg/mouse) with or without carnosol pretreatment (20 mg/kg) given 1 h earlier. Data are means ± SEM (n = 7–8). Statistical analysis was by Holm–Sidak's multiple comparisons test.
