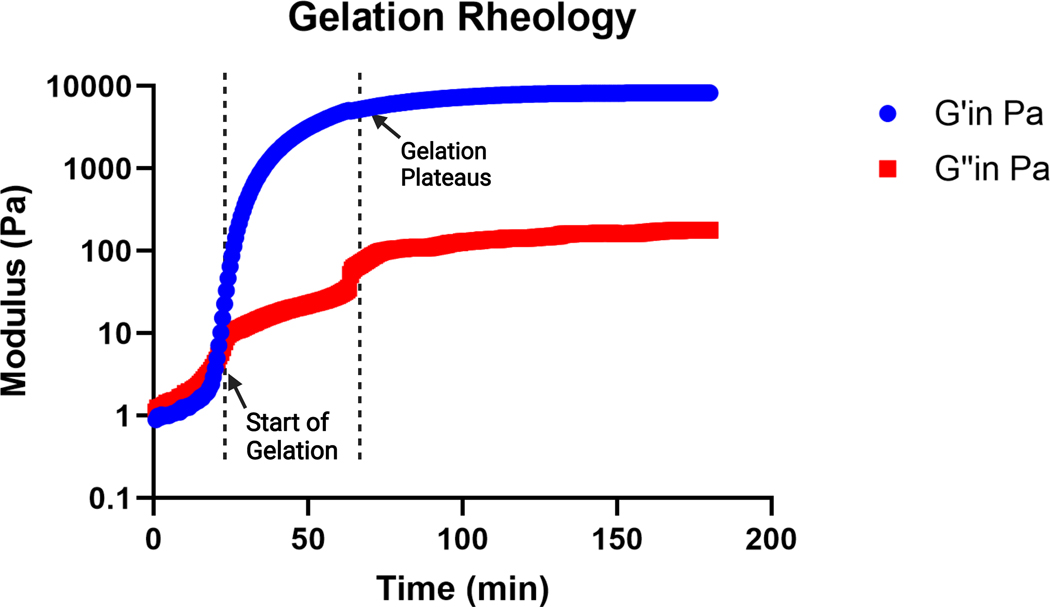
Figure 2: Representative curve of gelation kinetics of an MAP gel precursor solution (pH 4.5) determined by a viscometer.
Gelation begins at the rapid increase in storage (G’) modulus, and gelation completes when the G’ curve plateaus. G’’ indicates the loss modulus. This figure is from Pruett et al.3. Copyright (2021) Wiley-VCH GmBH.

