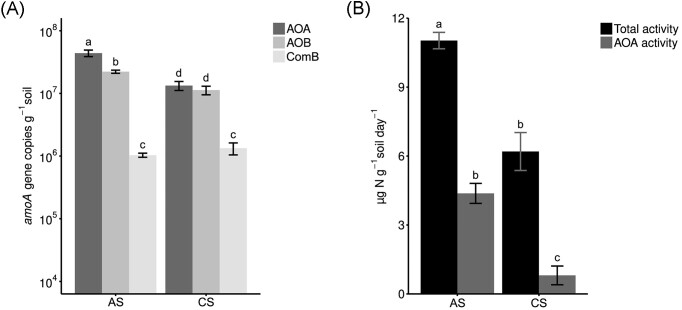
Figure 2.
Abundance of ammonia oxidizers, total net nitrification potential activity, and AOA contribution to the net nitrification potential. (A) Absolute abundance of ammonia oxidizers in the AS and the CS. (B) Total net nitrification potential activity and AOA contribution to the net nitrification potential. Lower case letters depict significant differences within and between soils. Samples collected in spring 2022. Error bars represent the standard error in each case (n = 4, P < .05).

