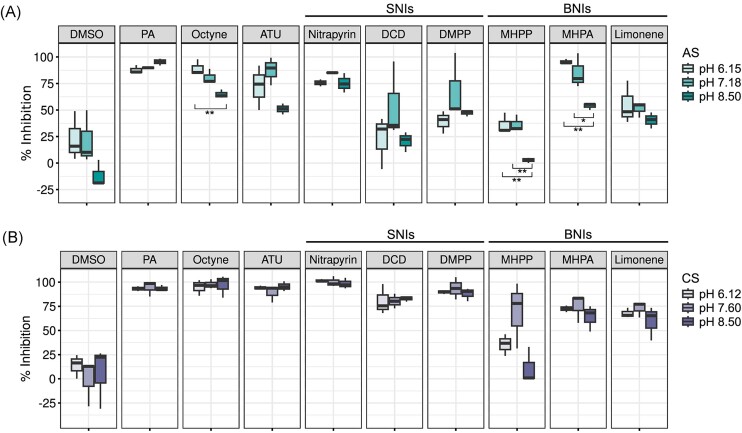
Figure 4.
Effect of soil pH manipulation on the efficacy of SNIs and BNIs in the (A) AS (pH 8.50), (B) CS (pH 6.12) PA: 1 mM Phenylacetelyne, 4 µM Octyne, 100 µM ATU, 3.5 µM Nitrapyrin, 100 µM DCD, 10 µM DMPP, 200 µM MHPP, 200 µM MHPA, and 200 µM limonene. Samples collected in spring 2022. The median is depicted as the middle hinge in the boxplots. Upper and lower hinges represent the first and third quartile. The length of the whispers is determined by the largest and the smallest value in the dataset that are within 1.5 times the interquartile range. (n = 3, *P < .05, **P < .01).

