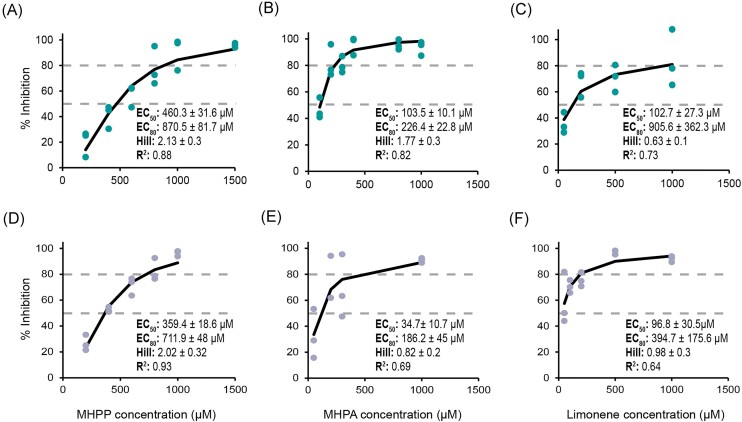
Figure 5.
Log-logistic model fitting to estimate the EC50 and EC80 values of three BNIs in the AS and CS. (A) and (D) log-logistic model for MHPP, (B) and (E) for MHPA, and (C) and (F) for limonene. (A), (B), and (C) correspond to the inhibitors assessed in the AS, and (D), (E), and (F) in the CS. The corresponding EC50, EC80 values (dashed lines), and hill coeficient, with their respective standard errors, as well as the R2 are displayed for each BNI in each soil.

