
Figure 7.
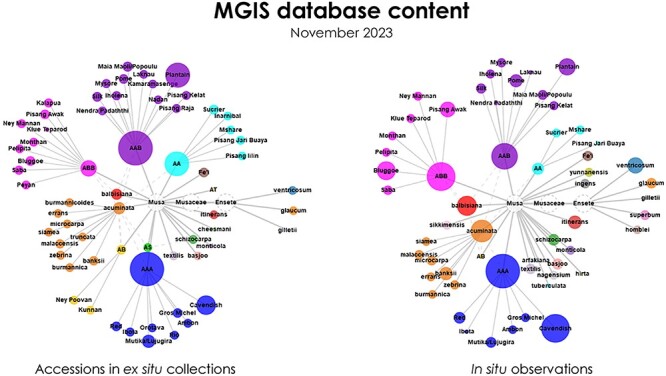
Diagram illustrating the in situ and ex situ taxonomic diversities of bananas, categorizing accessions and observations from family to subspecies/subgroup levels, as outlined by the MGIS. Bubble size corresponds to the quantity represented.