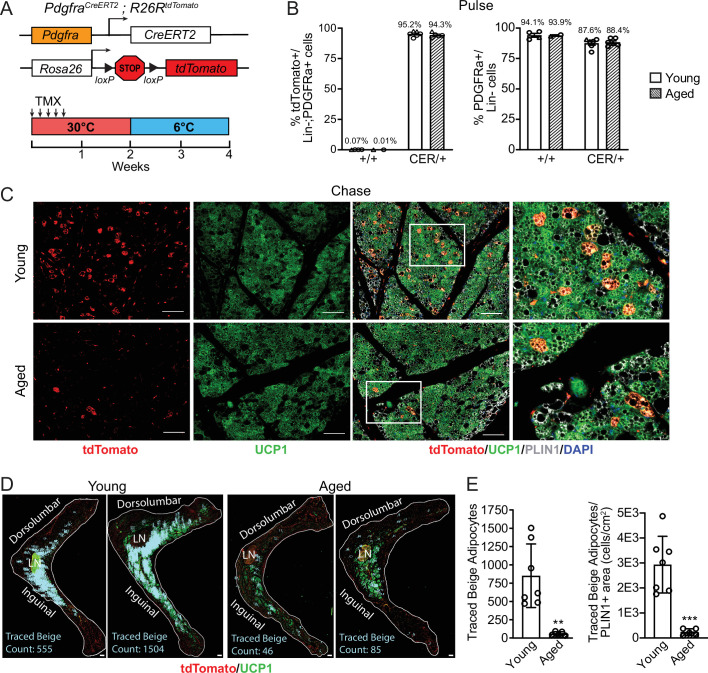
Figure 2. Aging blocks beige adipogenesis from fibroblastic ASPCs.
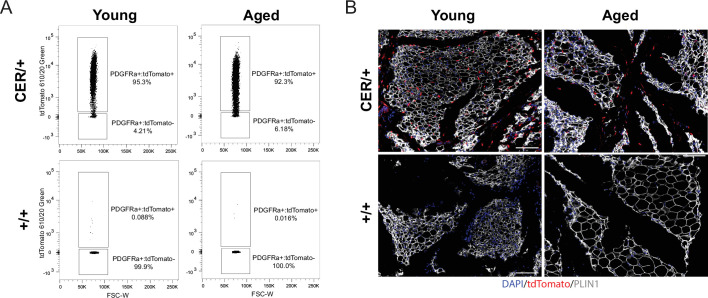
(A) Schematic of Pdgfra-CreERT2;R26R-tdTomato reporter mouse model and lineage tracing paradigm. (B) Flow cytometry-based quantification showing proportions of tdTomato-expressing cells (as % of total Live, Lin- (CD45-/CD31-, PDGFRα+ cells)) (left) and PDGFRα+ cells (as % of total Live, Lin- cells) (right) in iWAT from young and aged Cre- (control, +/+), and Cre+ (CER) mice. n=6 young, 5 aged (Circles represent male mice, triangles represent female mice). (C) IF analysis of tdTomato (red), UCP1 (green), PLIN1 (white) and DAPI (blue) in iWAT from young and aged reporter mice after 14 days of 6 °C cold exposure (chase). Scale bar 100 μm. (D) Representative stitched images of full length iWAT histology slices from samples in (C) showing quantification of traced tdTomato+; UCP1 + multilocular (beige) adipocytes (blue numbers). LN = lymph node, scale bar 500 μm. (E) Quantification of traced beige adipocytes from (D) presented as total cell number (left) or proportion of PLIN1 + area (right), n=7 (young), n=5 (aged). Data represent mean ± SEM, points represent biological replicates, two groups analyzed using a Student’s t-test, and multiple conditions analyzed with a two-way ANOVA with a Tukey correction for multiple comparisons. Significance: not significant, p>0.05; * p<0.05 ** p<0.01; *** p<0.001.


