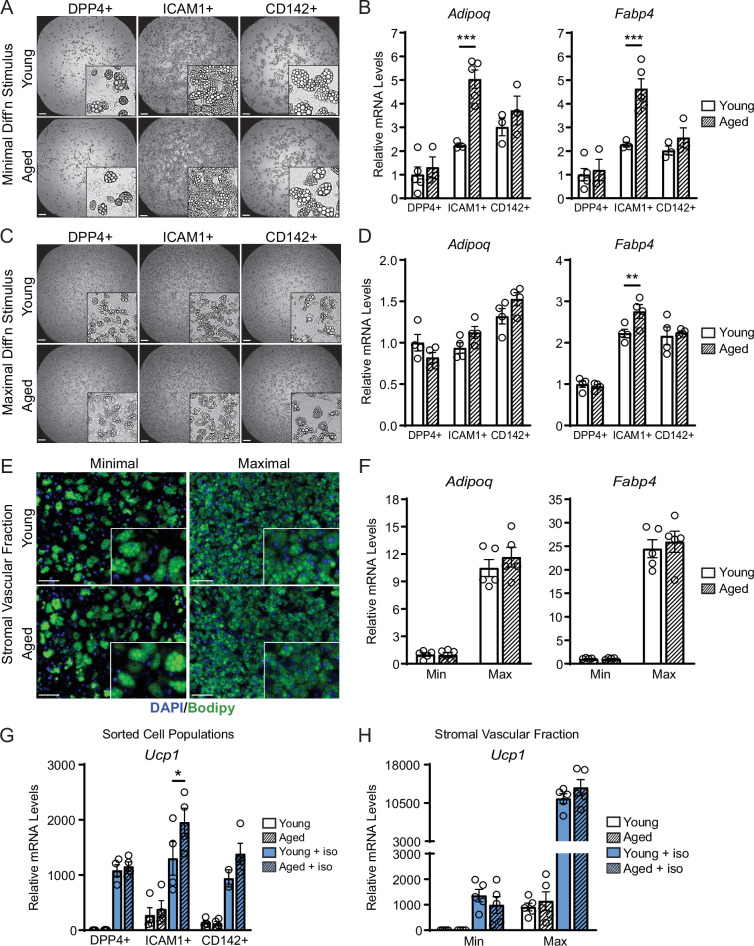
Figure 4. ASPCs from young and aged mice display similar beige adipogenic activity ex vivo.
(A, C) Phase contrast images of DPP4+, ICAM1+ and CD142+ cells from iWAT of young and aged mice that were induced to undergo adipocyte differentiation with minimal (Min, A) or maximal (Max, C) induction cocktail for 8 days. Scale bar 200 μm. (B, D) mRNA levels of adipocyte marker genes Adipoq and Fabp4 in cultures from (A, C). Data points represent separate wells, sorted from a pool of five mice (A) or sorted from two pools of two to three mice (C). (E) Stromal vascular fraction (SVF) cell cultures from the iWAT of young and aged mice were induced to differentiate for 8 days with Minimal or Maximal cocktail, followed by Bodipy (green) staining of lipid droplets and DAPI (blue) staining of nuclei. Scale bar 100 μm. (F) Relative mRNA levels of Adipoq and Fabp4 in cultures from (E). Data points represent wells from individual mice, n=5. (G, H) Relative mRNA levels of Ucp1 in adipocyte cultures from (C, E) with or without treatment with isoproterenol for 4 hr. Data points represent wells sorted from two pools of two to three mice (G) or wells from individual mice, n=5 (H). Data represent mean ± SEM, two groups analyzed using a Student’s t-test, and multiple conditions analyzed with a two-way ANOVA with a Tukey correction for multiple comparisons. Significance: not significant, p>0.05; * p<0.05 ** p<0.01; *** p<0.001.

