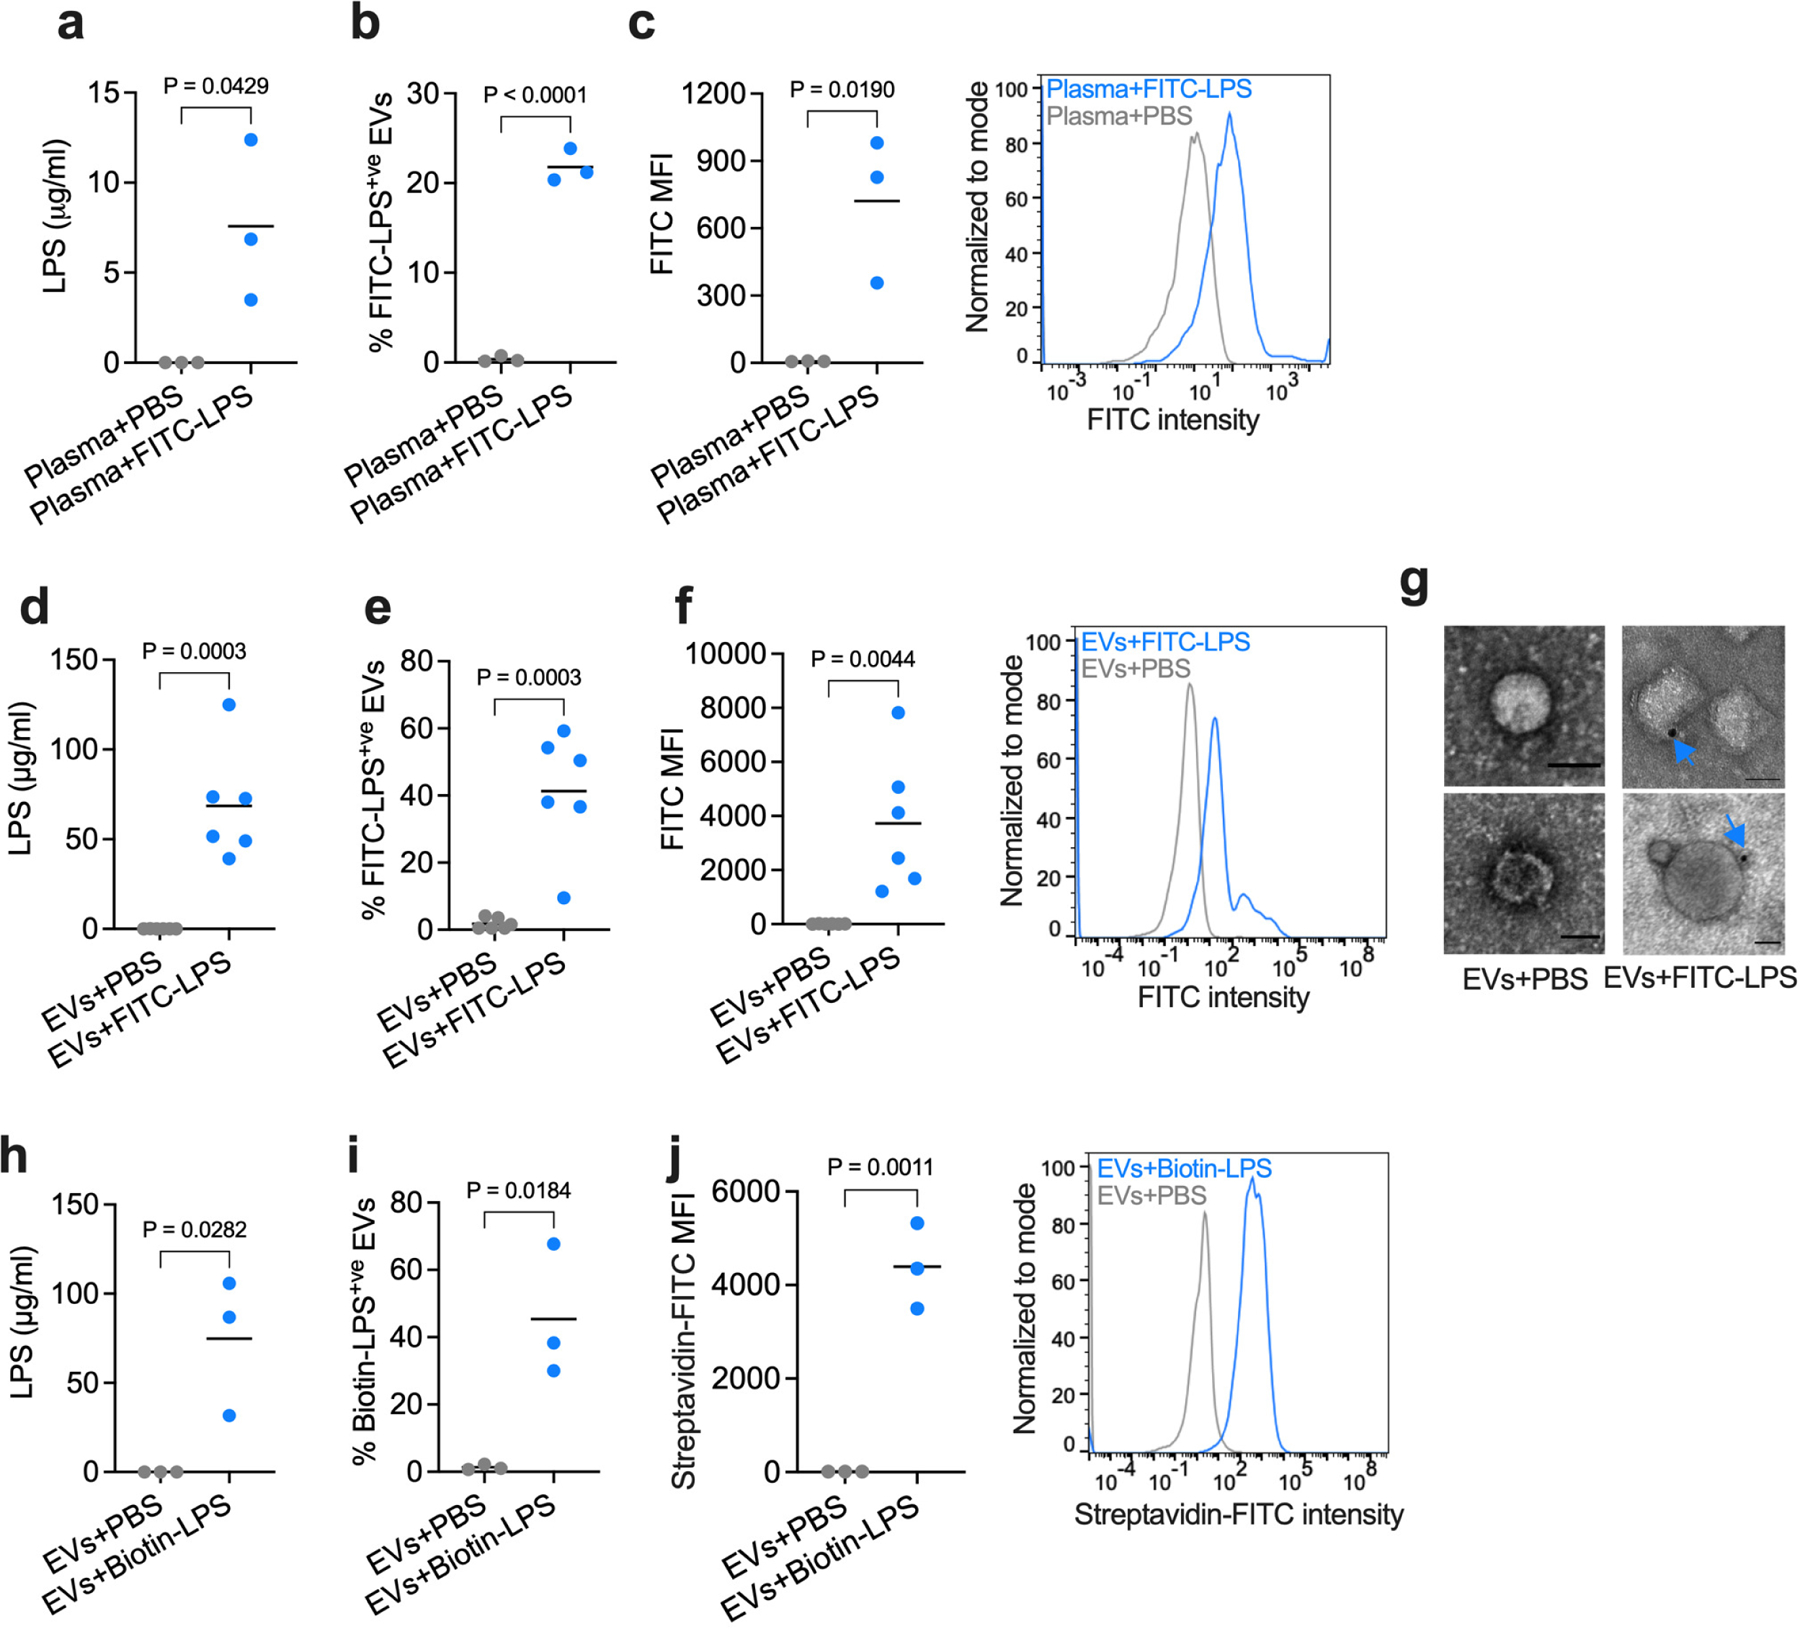
Extended Data Fig. 3: Plasma EVs bind LPS independent of blood components.

a, LPS content of the EVs isolated by the SEC method from the plasma incubated with PBS or FITC-LPS (500 μg) at 37 oC for 45 min as assessed by the LAL assay (n=3). b,c, Percentage of FITC-LPS+ve EVs (b) and FITC histogram and mean fluorescence intensity (MFI) of EVs (c) isolated by the SEC method from the plasma incubated with PBS or FITC-LPS in vitro as assessed by ImageStream flow cytometry (n=3). d–f and h–j, EVs isolated from the plasma by the SEC method were incubated with PBS, FITC-LPS, or biotin-LPS as indicated at 37 oC for 45 min in vitro, and the LPS binding was assessed by the LAL assay (n=3 or 6 as indicated) (d,h) and ImageStream flow cytometry (n=3 or 6 as indicated) (e,f,i,j). g, TEM of EVs isolated and treated as described above and stained with anti-FITC-gold particles. Arrows indicate LPS. Combined data from three (a–c and h–j) or six (d–f) experiments or one representative of two experiments (g) are shown. Each circle represents a mouse, and the horizontal lines represent the mean in a–f and h–j. P values were determined by unpaired two-tailed t-test. Scale bar, 50 nm (g).
