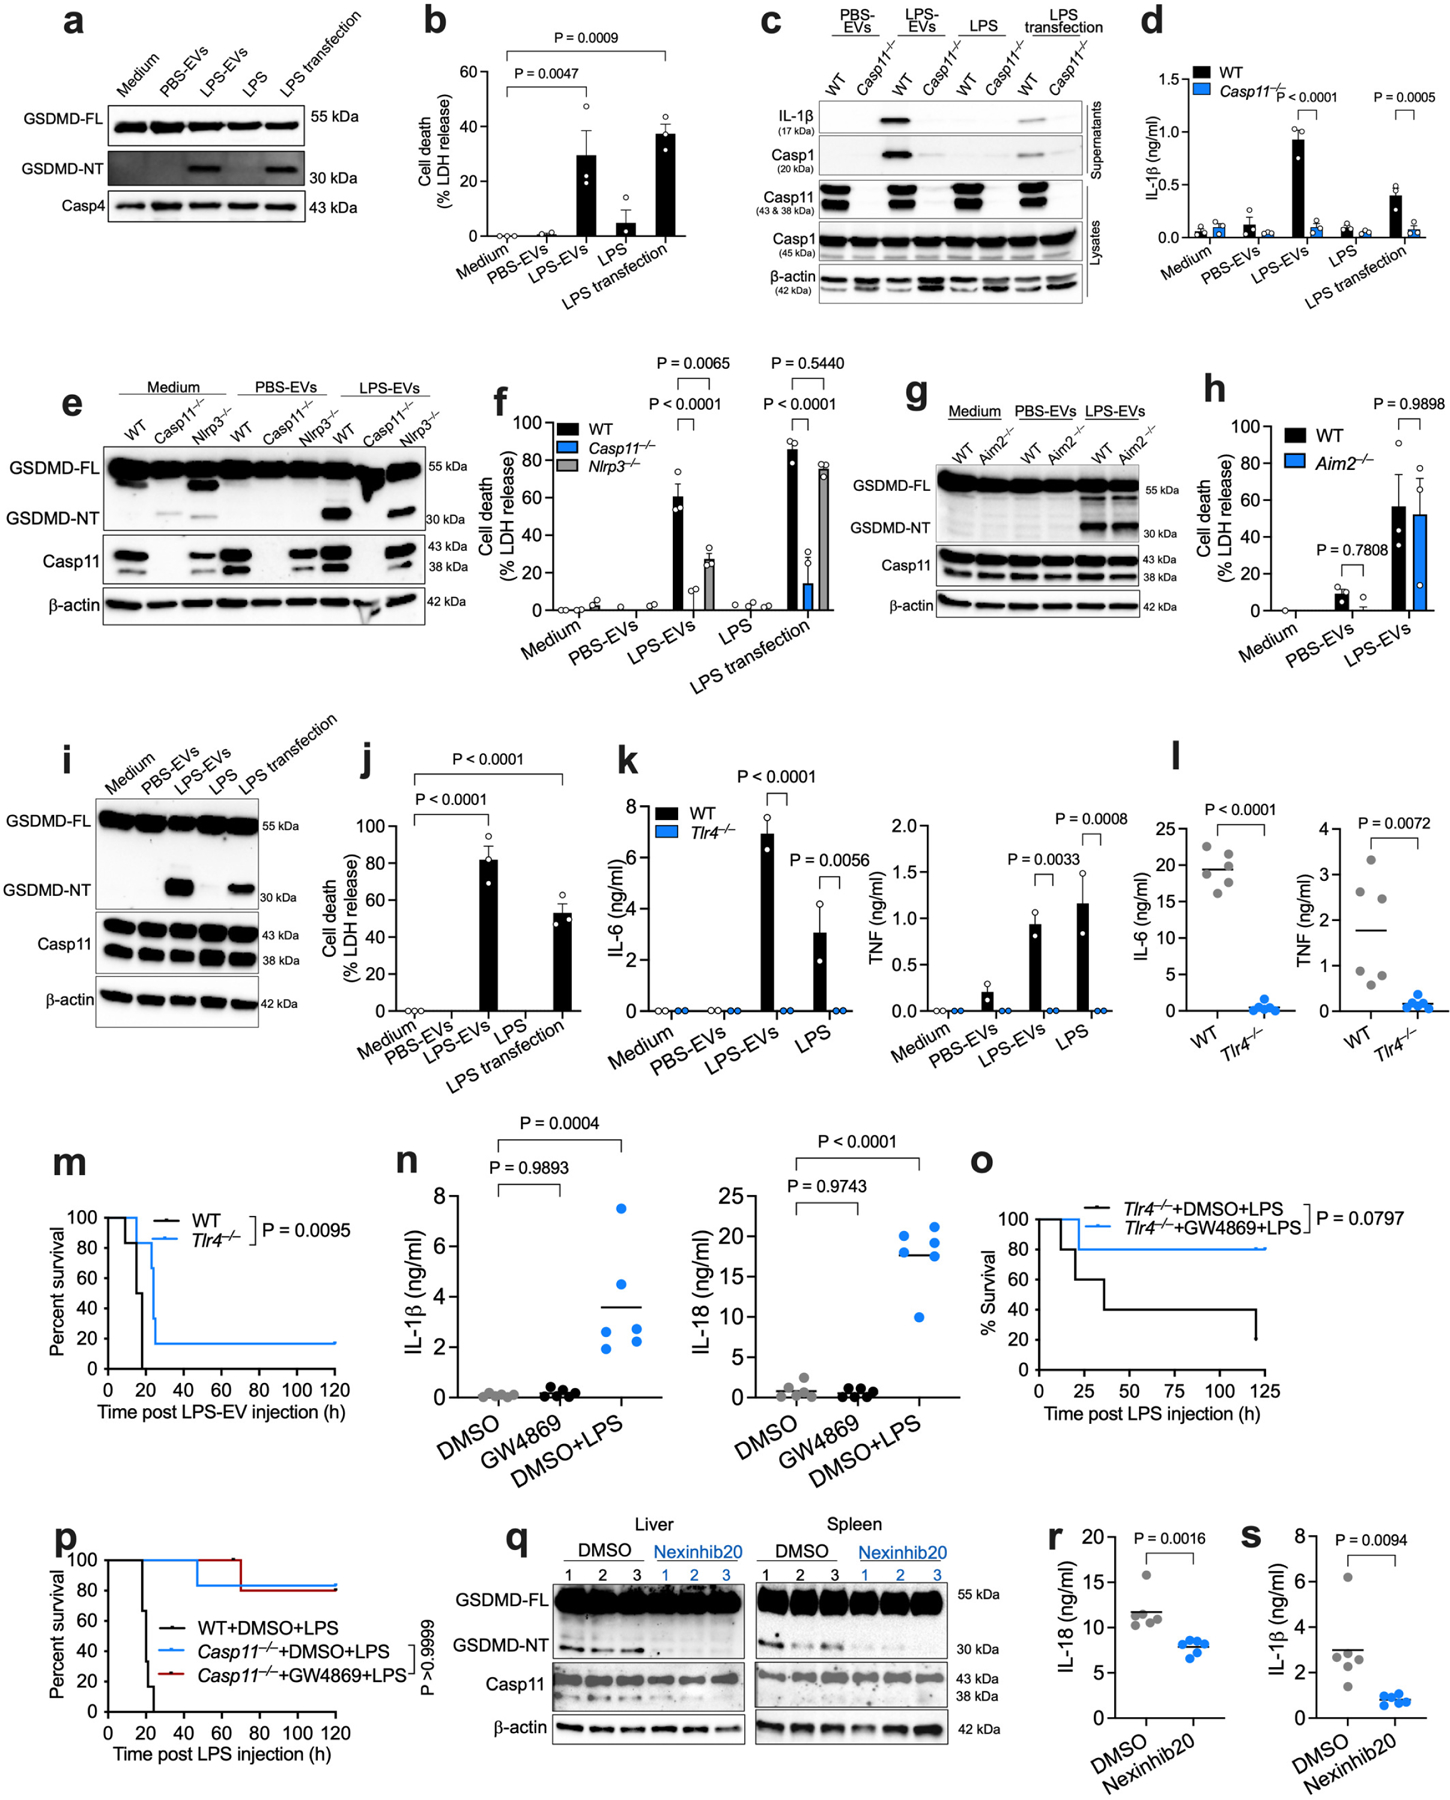
Extended Data Fig. 7: EV-bound LPS activates the noncanonical inflammasome.

a,b, GSDMD and caspase-4 in lysates (a) and cell death (b) of IFN-γ-primed (10 ng/ml) THP1 monocytes stimulated as indicated for 16 h. c,d, Cleaved IL-1β (p17) and caspase-1 (p20) in the supernatants and indicated proteins in lysates of (c) and IL-1β secretion (d) by IFN-γ-primed WT and Casp11−/− BMDMs stimulated as indicated for 16 h. e–h, GSDMD, caspase-11 and β-actin in lysates (e,g) and cell death (f,h) of IFN-γ-primed indicated BMDMs stimulated as indicated for 16 h. i,j, Indicated proteins in lysates (i) and cell death (j) of IFN-γ-primed RAW macrophages stimulated as indicated for 16 h. k, IL-6 and TNF secretion by indicated BMDMs stimulated with PBS-EVs, LPS-EVs (2.5 μg LPS/ml) or LPS (2.5 μg/ml) for 16 h. l, Plasma IL-6 and TNF in indicated mice administered with LPS-EVs for 6 h (n=6). m, Survival of poly(I:C)-primed WT and Tlr4−/− mice injected with LPS-EVs (n=6). n, Baseline IL-1β and IL-18 in the plasma of WT mice injected with DMSO (vehicle) or GW4869 (2.5 μg/g) twice 24 h apart. DMSO-treated LPS-injected mice are shown as controls (n=6). o, Survival of Tlr4−/− mice injected with DMSO or GW4869 (2.5 μg/g) on days 1–3, primed with poly(I:C) on day 3 and injected with LPS (25 μg/g) 6 h later (n=5). p, Survival of indicated mice injected with DMSO or GW4869 (2.5 μg/g) on days 1–3 and injected with LPS (25 μg/g) on day 3 (n=6). q–s, GSDMD, caspase-11 and β-actin in the liver and spleen (q) and IL-18 and IL-1β in the plasma (r,s; n=6) of WT mice pretreated with DMSO (2.5 μg/g) or Nexinhib20 (25 μg/g) on days 1 and 2 and injected with LPS (25 μg/g) on day 3 for 8 h. Each circle represents a mouse, and the horizontal lines represent mean (l,n,r,s). Each lane represents a mouse (q). Data are presented as mean±s.e.m (b,d,f,h,j,k). Combined data from two (k–p,r,s) or three (b,d,f,h,j) experiments or one experiment representative of two (a,c,e,g,i,q) are shown. P values were determined by one-way ANOVA with Dunnett’s post-test (b,j,n), two-way ANOVA with Sidak’s post-test (d,f,h,k), unpaired two-tailed t-test (l,r,s) or Mantel-Cox test (m,o,p).
