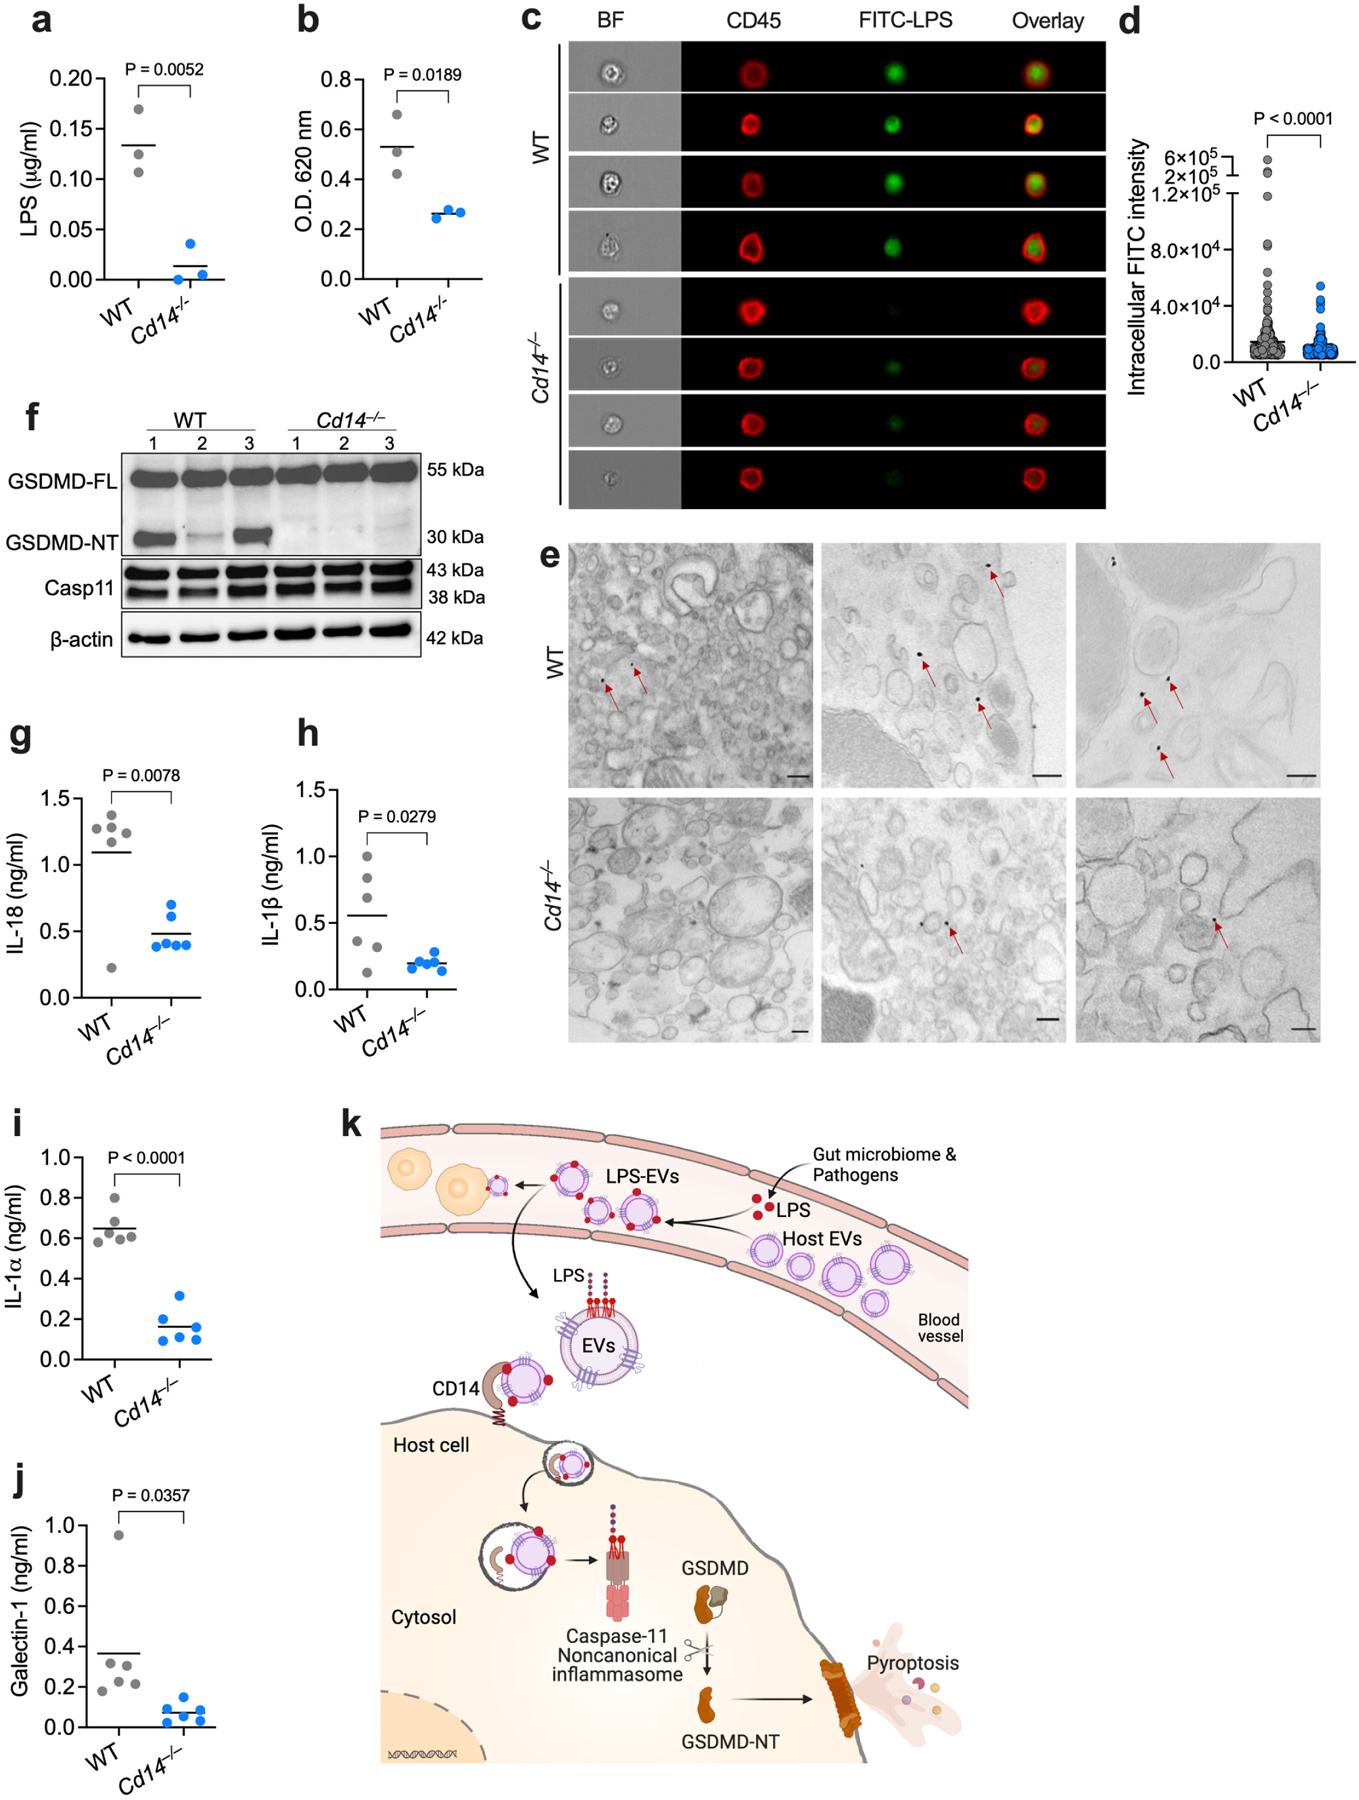
Fig. 7: EV-mediated cytosolic delivery of LPS is CD14-dependent.

a,b, LPS levels in the cytosol of splenic myeloid cells from WT and Cd14−/− mice injected with FITC-LPS-EVs for 5 h as assessed by the LAL (a) and HEK-TLR4 reporter cell (b) assays (n=3). c,d, ImageStream flow cytometric analysis of intracellular localization of LPS in splenic myeloid cells of FITC-LPS-EV-injected WT and Cd14−/− mice and stained with anti-CD45 and anti-FITC antibodies (c) and the quantification of intracellular FITC intensity (d). e, TEM of splenic myeloid cells isolated from FITC-LPS-EV-injected WT and Cd14−/− mice and stained with gold-conjugated anti-FITC antibody. Arrows indicate cytosolic localization of LPS. f–j, GSDMD, caspase-11 and β-actin in the spleen (f; n=3) and IL-18, IL-1β, IL-1α and galectin-1 in the plasma (g–j; n=6) of IFN-γ (1 μg)-primed WT and Cd14−/− mice injected with LPS-EVs for 6 h. k, Working model for the host EV capture and cytosolic release of LPS and noncanonical inflammasome activation (created with Adobe Illustrator and BioRender.com). Combined data from two (g–j) or three (a,b) independent experiments or representative data of two (c–f) independent experiments are shown. Each circle represents a mouse (a,b,g–j) or cell (d) and the horizontal lines represent the mean. Each lane represents a mouse (f). P values were determined by unpaired two-tailed t-test. Scale bar, 200 nm (e). BF, brightfield.
