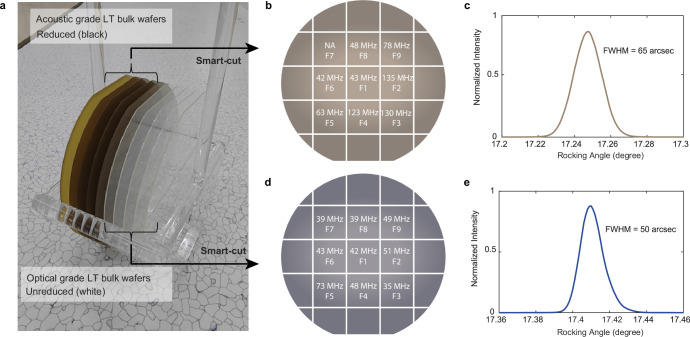
Extended Data Fig. 1. Optical loss of the acoustic and optical grade LTOI integrated photonic devices.
(a) Photo of the bulk acoustic and optical grade LiTaO3 wafers. The black and yellow wafers are reductive and original acoustic grade LiTaO3 bulk wafers, respectively. The white wafers are optical grade. (b) Wafer map of the optical loss of LiTaO3 microresonators fabricated on acoustic grade LTOI wafers. The resonators are 2 μm wide racetracks with 80 GHz free spectral range. Figure shows the most probable values of the intrinsic loss rate κ0/2π for a resonator from every field. The test chip from one field on the acoustic grade wafer was damaged before the measurement (shown as NA). (c) XRD rocking curve measured on the LiTaO3 (110) Bragg peak of the acoustic grade LTOI wafer after bonding and polishing. (d,e) Same as (b,c) but for optical grade LTOI wafer.

