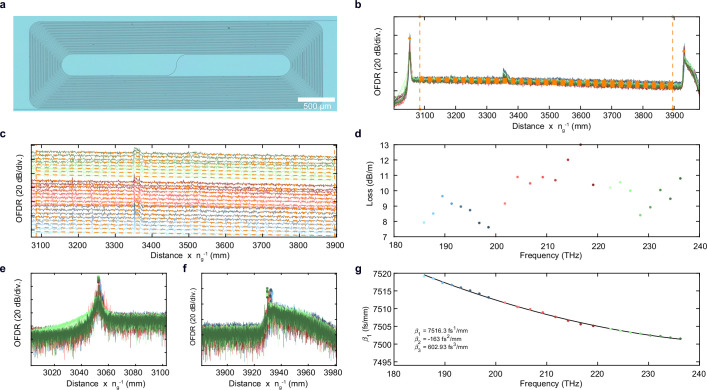
Extended Data Fig. 2. Linear loss and dispersion measurement.
(a) Optical micrograph of LTOI spiral (D101_LT_A2_F2_C7_Spiral5) with a length of 39 cm and a waveguide cross-section 1.75 μm × 0.6 μm. The rectangular footprint is 5 × 2 mm2. (b) Segmented Fourier transform of the optical frequency domain reflectometry (OFDR) signal showing the strength of the coherent optical backreflection as a function of the optical length. Colors encode the central wavelength of the segments and correspond to illustrations in panel (d). An optical distance of 88 cm can be identified according to the reflection peaks of the front and back facets of the waveguide spiral chip. A minor fabrication defect is found at an optical distance of 3.36 m. (c) Same as panel (b) but individual traces offset by 3 dB to highlight the linear fit for extraction of the optical propagation loss. (d) Optical propagation losses extracted from the fits in panel (c) showing a propagation loss of around 8 dB/m in the optical C- and L-bands and around 10 dB/m in the O-band. (e,f) Same as panel (b) but highlighting the regions around the front and back facet reflections of the chip. The colored markers point to the extracted position of the facet and are used to infer the dispersion of the spiral. (f) Frequency-dependent optical group velocity of the waveguide spiral and fit of the anomalous dispersion profile of β2 = -163 fs mm−2. The dispersion contribution of the 300 μm long tapers is neglected.

