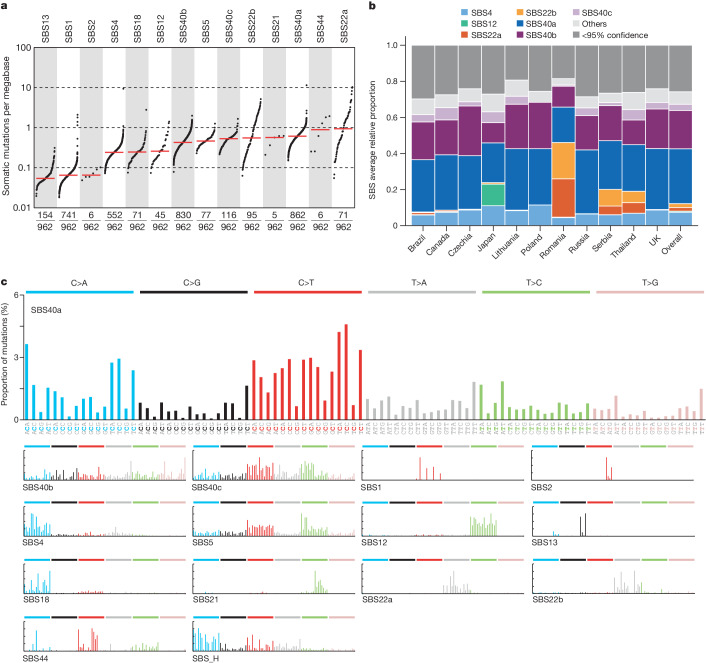
Fig. 2. SBS signature operative in ccRCCs.
a, TMB plot showing the frequency and number of mutations per megabase for each of the decomposed SBS signatures. Data include only samples with more than zero mutations. b, Average relative attribution for SBS signatures across countries. Signatures that contribute less than 5% on average are grouped in the ‘others’ category, except for SBS12 and the aristolochic acid-related signatures SBS22a and SBS22b. The ‘<95% confidence’ category accounts for the proportion of mutation burden that could not be assigned to any signature with confidence level of at least 95%. c, Decomposed signatures, including reference COSMIC signatures as well as de novo signatures that are not decomposed into COSMIC reference signatures.

