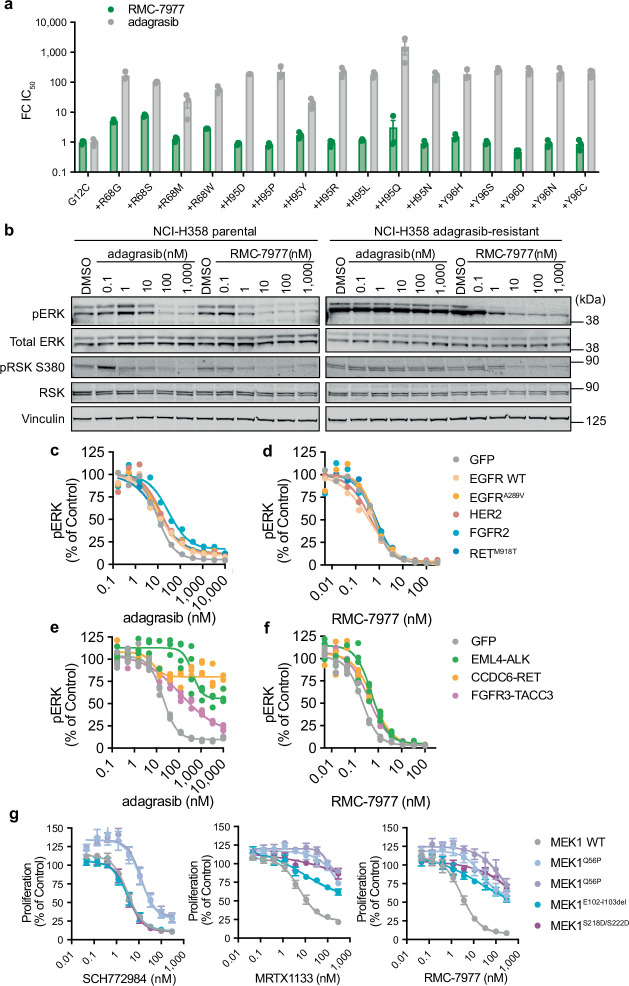
Extended Data Fig. 10. RASMULTI inhibition overcomes G12C inhibitor resistance mechanisms.
a, Cellular nano-BRET assay showing fold-change IC50 of disrupting the KRAS:CRAF interaction in U2O2 cells expressing KRASG12C alone or with the indicated secondary mutation in the SWII domain and treated with RMC-7977 or adagrasib for 4 h. Bars represent mean of n = 3 biological replicates ±s.e.m. b, Western blots of parental NCI-H358 (KRASG12C, NSCLC) and an adagrasib resistant clone of NCI-H358 cells with a secondary NRASQ61K mutation. Cells were treated with adagrasib or RMC-7977 for 4 h. c,d, pERK levels (MSD) in NCI-H358 (KRASG12C, NSCLC) cells expressing exogenous RTK DNA constructs indicated by color (GFP control, EGFRWT EGFRA289V, HER2, FGFR2, or RETM918T, treated with adagrasib (c) or RMC-7977 (d) for 24 h. e,f, pERK levels (MSD) in MIA PaCa-2 (KRASG12C, PDAC) cells expressing exogenous RTK fusion DNA constructs indicated by color (GFP control, EML4-ALK, CDC6-RET, FGFR3-TACC3), treated with adagrasib (e), or RMC-7977 (f) for 24 h. n = 2–4 biological replicates per group, normalized to control. Data shown are representative of independent experiments (NCI-H358 n = 3, MIA PaCa-2: n = 2). g, Pa16C (KRASG12D, PDAC) cells expressing exogenous MEK1 mutant DNA constructs were treated with the indicated inhibitors for 120 h, and proliferation was measured by Calcein AM. n = 3–5 biological replicates from a single experiment, datapoints represent mean ± s.e.m normalized to control.

