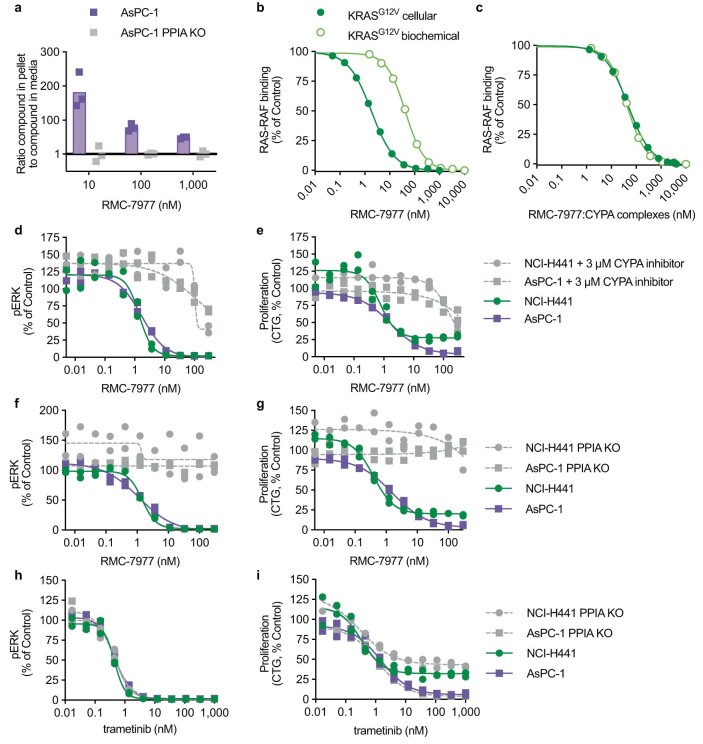
Extended Data Fig. 4. Cellular concentration of CYPA determines the cellular concentration of binary complex.
a, Ratio of RMC-7977 concentration in cells to concentration in media following exposure of parental or PPIA KO AsPC-1 cells to indicated concentrations of RMC-7977 for 1 h as determined by LC/MS bioanalysis. Bars represent mean of the 3 biological replicates shown from one experiment. b, RMC-7977 concentration response for biochemical (points are the mean of biological duplicates from one of 6 independent experiments) and cellular (3 independent experiments) nano-BRET KRASG12V-RAF disruption. Data shown are representative of independent replicates. c, same data as b, with calculated concentration of active binary complexes. Correction is based on equation 1: . This calculation assumes the extracellular volume is much greater than the intracellular volume and that the concentration of unbound RMC-7977 ([RMC-7977]unbound) equilibrates between intracellular and extracellular space. A value of 5 µM was used for the cellular CYPA concentration ([CYPA]cell). No adjustment was applied to the biochemical data because under experimental conditions >99% of RMC-7977 is bound to CYPA. d-i, pERK levels (MSD) (d,f,h) and cell proliferation (CTG) (e,g,i) in AsPC-1 and NCI-H441 cells treated with RMC-7977 or trametinib for 4 h. RMC-7977 co-treatment with a CYPA inhibitor12 (d,e) or PPIA KO (f,g) rescued pERK and proliferation in RMC-7977 treated cells, but did not affect response to trametinib (h,i). Representative data from one of 2 (NCI-H441) or 3 (AsPC-1) independent experiments are shown.

