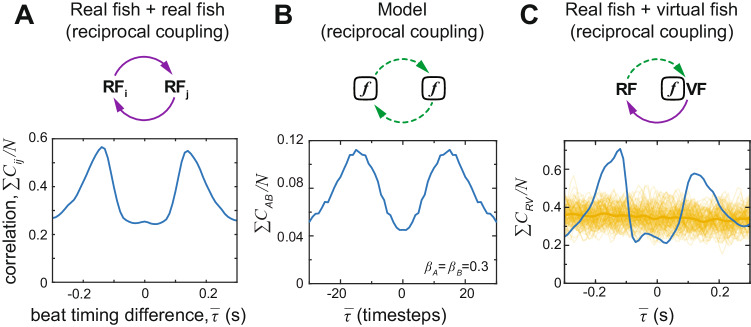
Fig. 3. A comparison of the temporal swimming patterns of two real fish, two simulated agents, and real-virtual fish pairs in interactive virtual reality.
The normalized correlation function Cij of the beats (see Fig. 1D) as a function of the mean beat timing difference . A Two real fish swimming together in the same arena. B Simulation of two interactive agents using the model with β = 0.3 for the stochastic parameter produces similar temporal patterns as for 2 real fish. C Results for real fish swimming with an interactive virtual fish whose reciprocal behavior is controlled by the model. Due to the small but inherent noise (and delay) in the VR system, here β was set to 1 to avoid adding additional noise. The curve in blue shows the actual correlation function, whereas shuffled pairs generated by randomization (randomizing the entire dataset 100 times, resulting in 100 different curves; see the methods section for more details) are in yellow.

