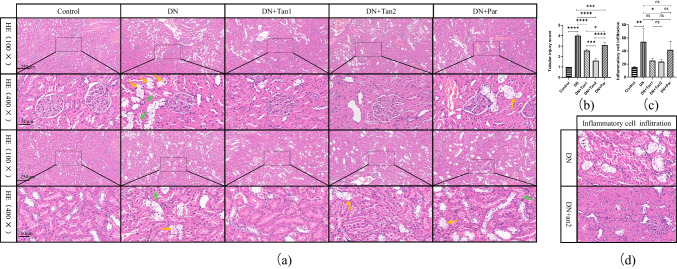
Fig. 4.
The effects of Tan (5.4 mg/kg), Tan (10.8 mg/kg), and Par (0.054 µg/kg) on the HE staining in DN rats. a Pathological changes of glomeruli and tubules in HE staining sections at 100 × and 400 × . b Tubular injury score, analysis of HE staining results of renal tissue in five groups. c Quantitative analysis of inflammation cell infiltration. d HE staining of inflammatory cell infiltration. Yellow arrows, tubular epithelial cells with vacuolar and particle denaturation. Green arrows, cell fragments or tube-type cells. Black arrows, inflammation cell infiltration

