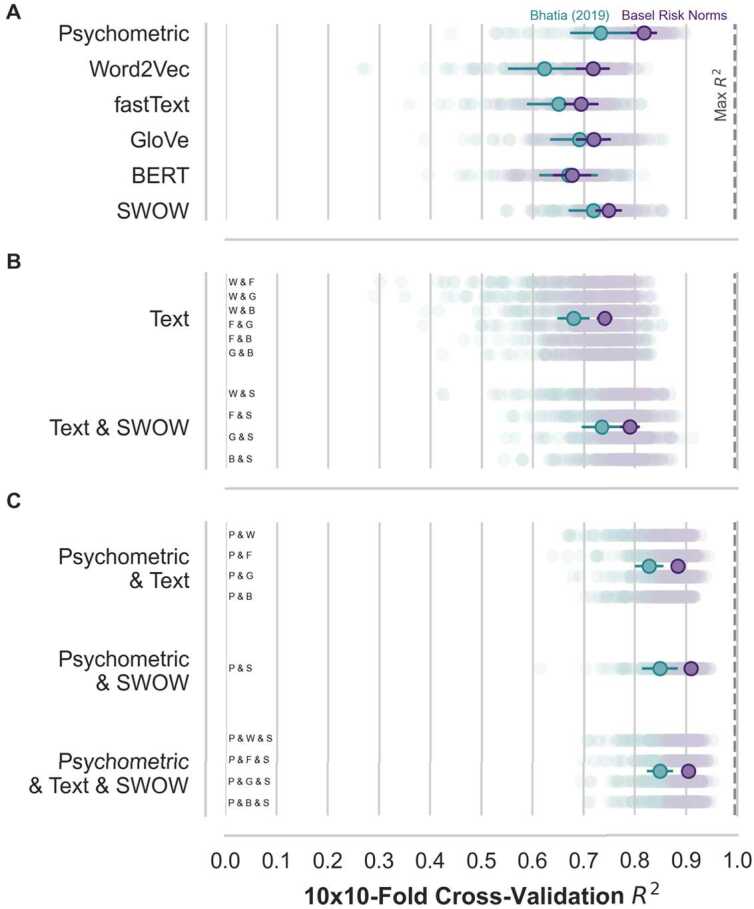
Figure 2.

Prediction of risk perception. A model comparison using the Basel Risk Norms (1004 risks) and [15]’s data (306 risks). Foreground points are the (grand) means of the test set performances used in cross-validation (10×10-Fold) whereas background points reflect the individual test set performances. The Max (vertical dashed line) represents the reliability of the risk ratings. A. Individual model comparison. B. Text and SWOW Ensembles. C Psychometric, Text, and SWOW Ensembles. Error bars are adjusted 95% confidence intervals [27]. Model ensembles in B. and C. are labeled with letters representing the individual models composing them: P = Psychometric, W = Word2Vec, F = fastText, G = GloVe, B = BERT, S = SWOW
