Fig. 1.
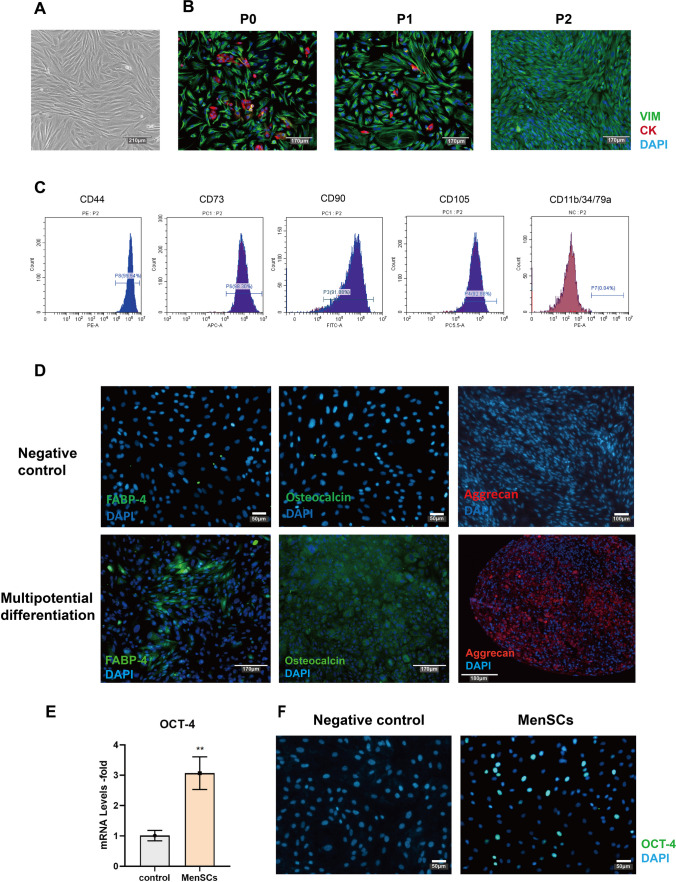
Isolation and identification of MenSCs. A The morphology of MenSCs in the bright-field. Scale bar: 210 μm. B Cell composition in primary cell (P0), passage 1 (P1), and passage 2 (P2). Green represents the stromal cell marker (VIM), red represents the epithelial cell marker (CK7), and blue represents the nuclear marker (DAPI). Scale bar: 170 μm. C Isolated MenSCs at passage 4 were used for flow cytometry analyses, and the values represent the percentage of positive cells among all cells. CD44 (99.54%), CD73 (98.30%), CD90 (91.88%), CD105 (92.88%), CD11b/CD34/CD79a (0.04%). (D) Immunofluorescence staining verified the multipotent differentiation ability of the MenSCs, representing the ability of adipogenesis (FABP-4), osteogenesis (osteocalcin), and chondrogenic (aggrecan) differentiation, negative control was undifferentiated MenSCs. Negative control scale bar: 50 μm. Multipotential differentiation scale bar: 170 μm. E OCT-4 gene expression in the MenSCs, the control is fibroblast cells. F OCT-4 protein in the fibroblast (negative control) and MenSCs. Scale bar: 50 μm

