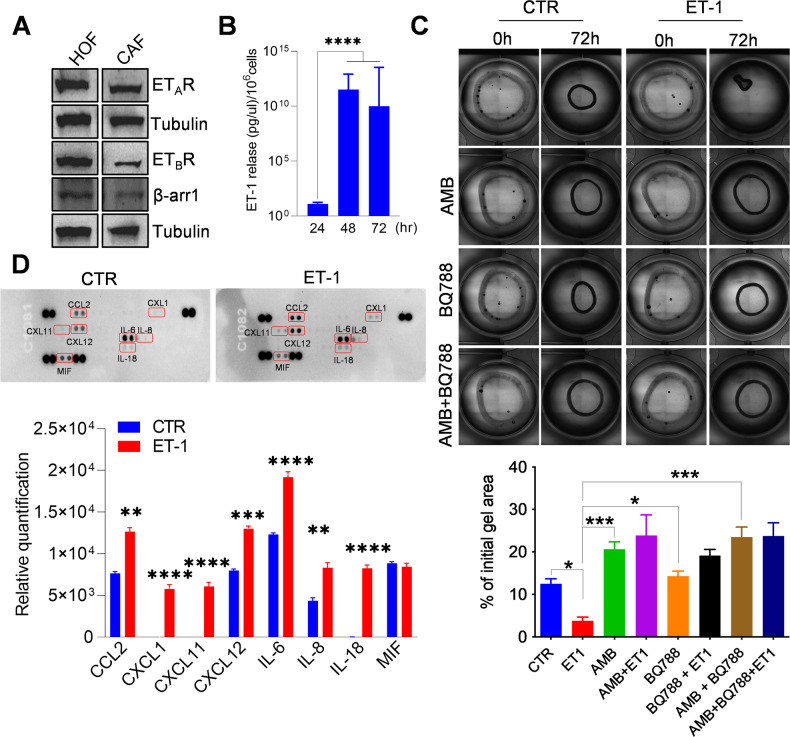
Fig. 1. ET-1/β-arr1 axis activates human ovarian fibroblasts (HOFs).
A Representative Western blotting (WB) of whole cell lysates probed with Abs to ETAR, ETBR, and β-arr1. Tubulin, loading control. B ET-1 secretion measured by ELISA in conditioned media (CM) from HOFs at indicated time points. Histograms represent the mean ± SD. Statistics were obtained using One-way ANOVA, n = 2. C Collagen contraction assay by using HOFs stimulated with ET-1 and/or AMB (ETAR antagonist) and/or BQ788 (ETBR antagonist) after 72 h. Histograms represent the mean ± SD; statistics were obtained using One-way ANOVA. D Cytokine release evaluated in CM from untreated or ET-1-treated HOFs (24 h) by using cytokine profiler array. Histograms represent the mean ± SD, n = 2 of the analytes detected; statistics were obtained using One-way ANOVA.

