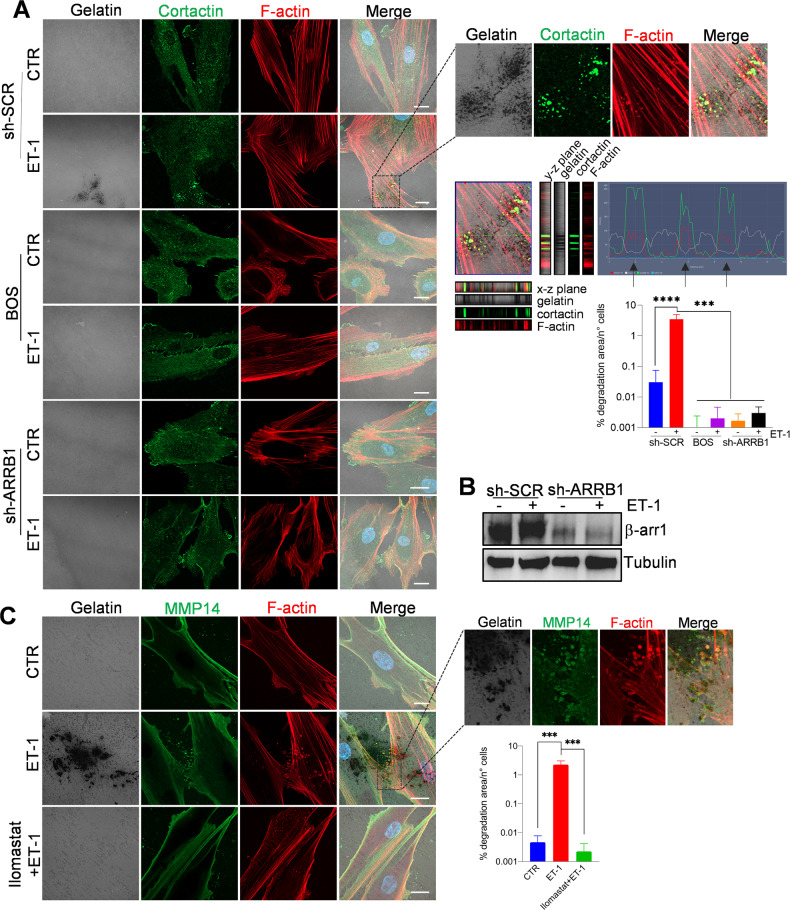
Fig. 2. ET-1 regulates invadosome formation and activation.
A Confocal laser scanning microscopy (CLSM) analysis of sh-SCR or sh-ARRB1 HOFs, plated onto gelatin and treated with ET-1 and/or BOS (ETA/BR antagonist) for 48 h. Cells were stained for Cortactin (green) and F-actin (red), nuclei in blue (DAPI). Gelatin was reported in pseudo-color gray. Degradation areas appear as black holes, while co-localization is shown in merged images (pseudo-color yellow). Orthogonal views (y-z plane; x-z plane) indicate areas of degraded gelatin with co-localized F-actin and cortactin. Right, separate channels and merged images of the selected ROI and the histogram profiles of F-actin/cortactin/gelatin signals in the line drawn. B Representative WB of whole cell lysates from sh-SCR or sh-ARRB1 HOFs stimulated or not with ET-1 and probed with Ab to β-arr1. Tubulin, loading control. C CLSM analysis of HOFs, plated onto gelatin and treated with ET-1 or Ilomastat (MMP inhibitor). Cells were stained for MMP14 (green) and F-actin (red). Co-localization is shown in merged images (pseudo-color white or yellow). Right, separate channels and merged images of the selected ROI. Scale bar, 20 μm. Histograms (A, C) represent the mean ± SD of the normalized degradation area percentage of cells; statistics were obtained using the One-way ANOVA.

