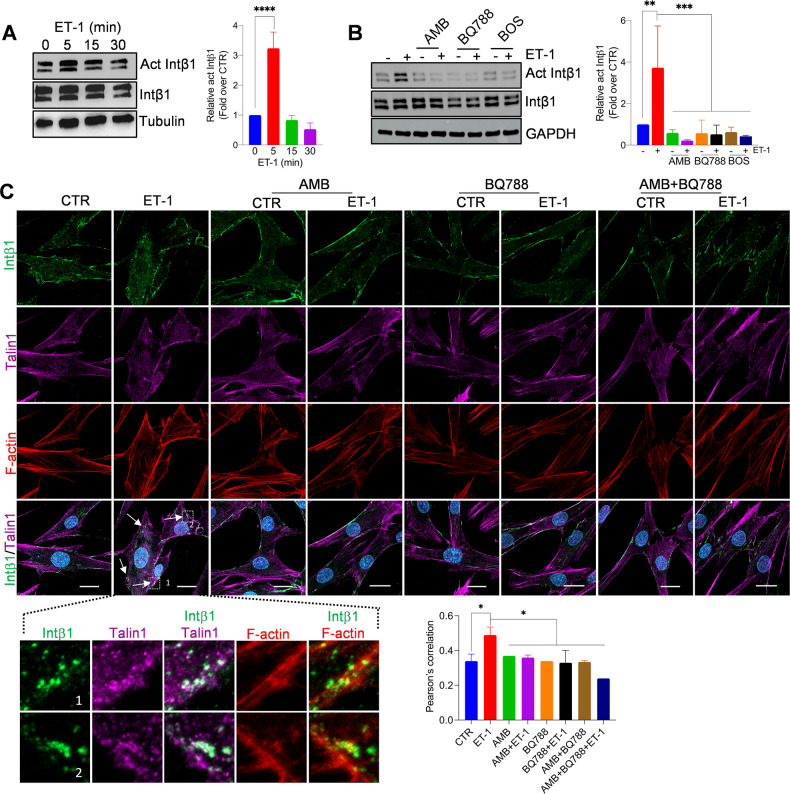
Fig. 4. ET-1/ETA/BR regulates Intβ1/talin1 signaling through β-arr1.
Representative WB of whole cell lysates from HOFs stimulated with A ET-1 at indicated times or B ET-1 (5 min) and/or AMB and/or BQ788 and/or BOS. Tubulin and GAPDH, loading control. Histograms represent the mean ± SD of densitometric analyses of proteins relative to GAPDH; statistics were obtained using One-way ANOVA. C CLSM analysis of HOFs stimulated with ET-1 for 5 min and/or AMB and/or BQ788 and/or AMB + BQ788, stained for active Intβ1 (green), talin1 (magenta) and F-actin (red) detection. Co-localization is shown in merged images (pseudo-color white or yellow). Columns represent the mean ± SD of quantification of Pearson’s correlation between act Intβ1 and talin1; statistics were obtained using one-way ANOVA.

