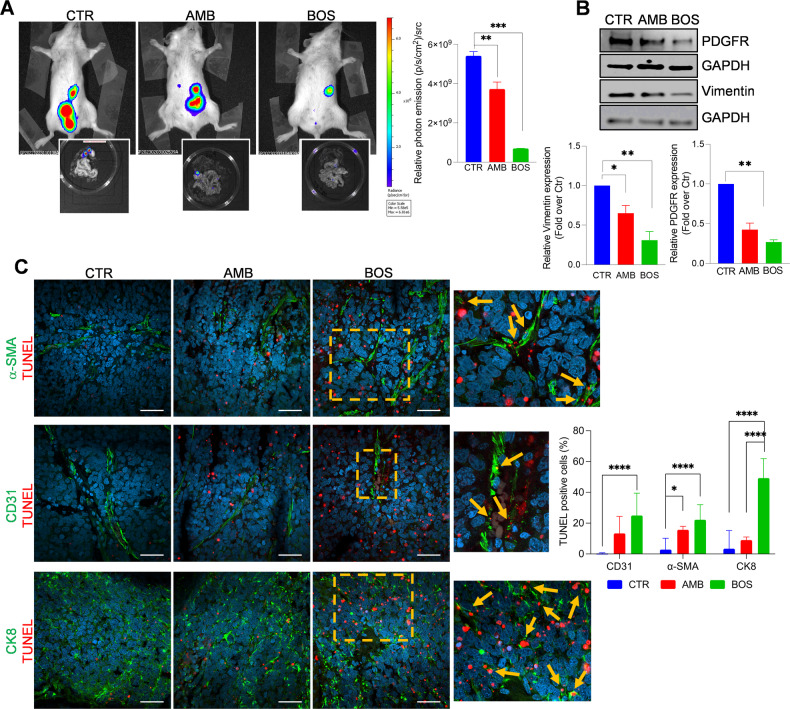
Fig. 7. ETA/BR blockade suppresses the metastatic potential of CAFs/SOC cells.
A Bioluminescent images of intraperitoneally (i.p) injected SKOV3-Luc (3 × 10⁶)/HOF-Luc (1 × 10⁶)-cells in NOD/SCID mice, undergoing treatments for 5 weeks with Methocel (vehicle, CTR) or AMB (10 mg/kg, oral daily), BOS (10 mg/kg, i.p. daily). Data are presented as mean ± SD, n = 2, one-way ANOVA. Inset, images of i.p. organs visualized by BLI. B Representative WB of whole cell lysates from metastatic nodules probed with Abs to PDGFR and Vimentin. Histograms represent the mean ± SD of densitometric analyses of proteins relative to GAPDH; statistics were obtained using one-way ANOVA. C CLSM examinations (three-dimensional reconstruction images) of Formalin-Fixed Paraffin-Embedded (FFPE) tissue sections (5 µm thick) from untreated (CTR) and AMB or BOS-treated mice. Sections were stained for TUNEL detection (red) in combination with anti-αSMA (upper panels), anti-PECAM1/CD31 (middle panels) or anti-cytokeratin-8 (lower panels) primary Abs, showed in green. Nuclei were stained with DAPI (blue). Merged images are reported and colocalizations are shown in yellow. Insets represent higher-power magnification images of selected areas with TUNEL staining in proximity of the specific markers (arrows), indicating apoptotic events in tissues from BOS-treated mice. Scale bar, 50 µm. n = 2. Histograms represent the ratio of the TUNEL-positive cells in the region of interest to the TUNEL-positive cells in the whole section relative to the number of cells (nuclei). One-way ANOVA.

