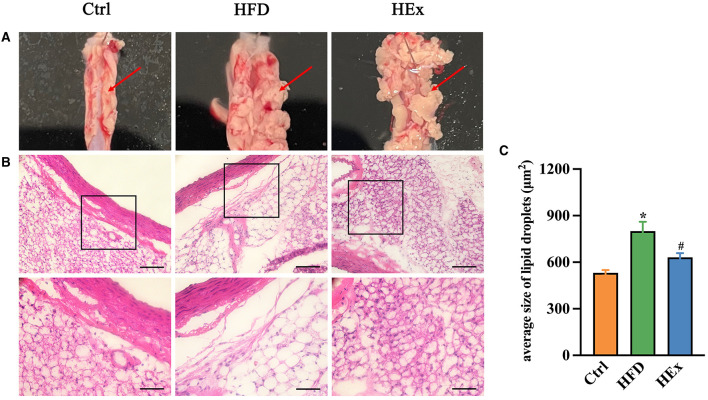
Figure 2.
Analysis of the characteristics of PVAT. (A) Morphology of PVAT in thoracic aortic segments of rats. (B) Representative images of H&E staining of aorta PVAT (n = 6). Digital images were captured using 20X and 40X magnification (middle and lower panels). Scale bar = 100/50 μm. (C) Quantified data showing the average size of lipid droplets in PVAT (n = 6). The data are presented as mean ± SEM. The results are significant compared to the control group (*p < 0.05) and the HFD group (#p < 0.05).

