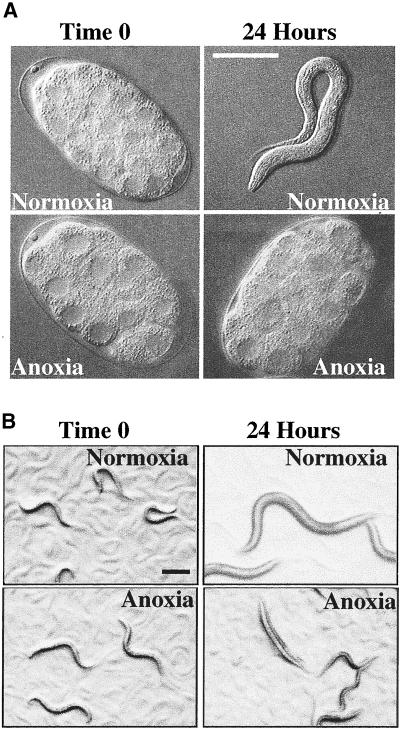
Figure 1.
C. elegans arrest when exposed to anoxia. (A) Two-cell embryos were collected and exposed to either a normoxic (21 kPa, 21% O2) environment or an anoxic (0 kPa, 0% O2) environment. Nematodes were visualized using Nomarski optics. Images were collected and analyzed using NIH image and Adobe Photoshop 5.5. Embryos are ∼50 μm in length. Bar, 50 μm for image showing L1 larva only. (B) L3 larvae were collected and exposed to either a normoxic or an anoxic environment for 24 h. Nematodes were visualized using a dissecting microscope. Images were collected and analyzed using Metamorph and Adobe Photoshop 5.5. Bar, 200 μm. For A and B, methods used to establish the anoxic environment required ∼60–90 min. During most of this transition period animals behaved and developed at a rate comparable to untreated nematodes. Time 0 is the time nematodes began to arrest development. The second time point is 24 h after time 0.

