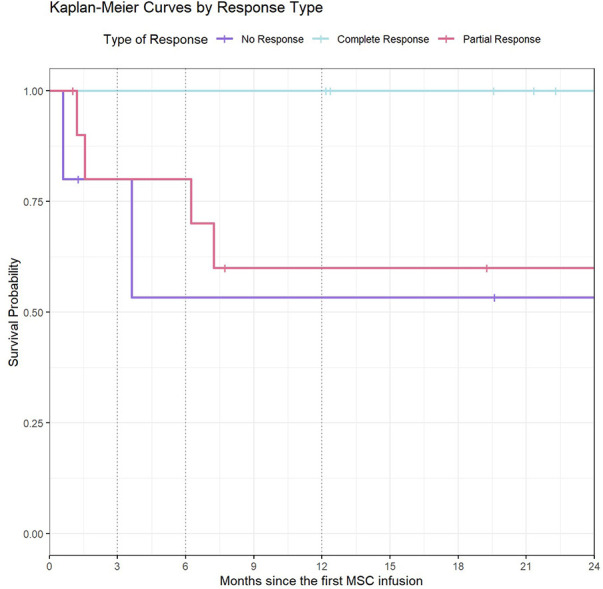
Figure 3.

Kaplan-Meier curves by type of response. This graph represents the survival time (in months) from 1st MSC infusion, in relation to each type of treatment response. For patients with NR, OS was 53% (95% CI: 21–100) at 6 months of follow-up onwards. In the PR group, OS was 80% (95% CI: 60–100) at 6 months of follow-up and 60% (95% CI: 36–100) from 12 months onwards. Since no death were observed in the CR group, the survival probability was 100%.
