Fig. 1.
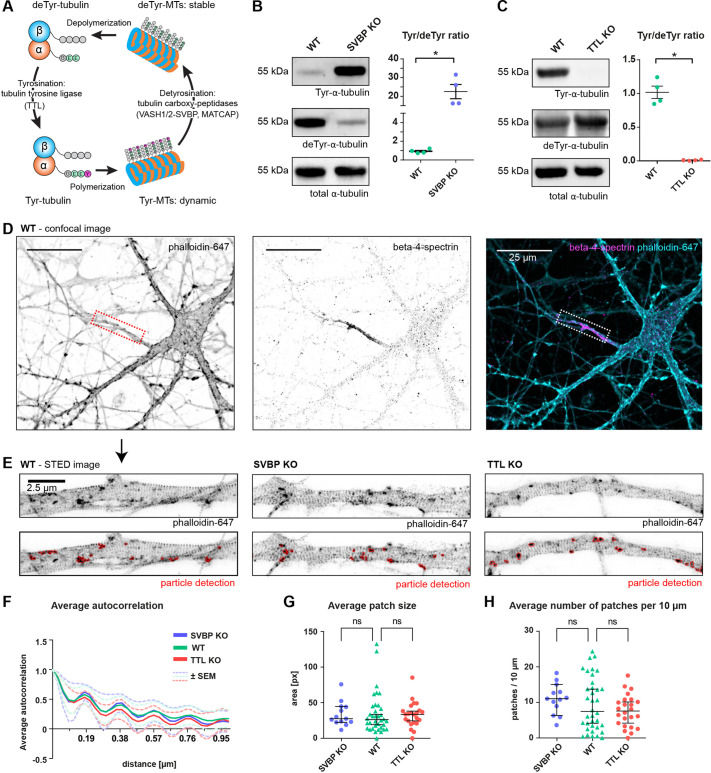
Imbalanced MT tyrosination and detyrosination does not affect the nanostructure of the F-actin cytoskeleton in the AIS. (A) Illustration of the tubulin tyrosination–detyrosination cycle. (B,C) Immunoblot quantifications of the ratio of tyrosinated versus detyrosinated tubulin from crude lysates of cultured mouse cortical neurons at DIV15 with SVBP-KO (B) and TTL-KO (C) compared to WT neurons. n=4, with three independent cultures for both WT and SVBP-KO, and four and three independent cultures for WT and TTL-KO, respectively. *P<0.05 (Mann–Whitney test with Dunn's multiple comparison test). (D) Confocal images of DIV12 neurons stained with phalloidin-647 (an F-actin marker) and with an antibody against β4-spectrin to identify the AIS (dashed box). Scale bars: 25 µm. (E) Representative STED images of F-actin in the AIS of WT, SVBP-KO and TTL-KO neurons. Lower panels show particle detection in FIJI used for quantification of F-actin patches. Scale bar: 2.5 µm. (F) Average autocorrelation of the F-actin signal periodicity in the different genotypes shows a 190 nm periodicity in WT, SVBP-KO and TTL-KO AIS. Shown is the mean±s.e.m. Calculation of autocorrelation was performed as described previously (Vassilopoulos et al., 2019, see Materials and Methods). (G) Average size (px, pixels) of F-actin patches present inside the AIS. Medians are SVBP-KO 27.65 px, WT 26.22 px, TTL-KO px 33.8. Pixel size, 30×30 nm. (H) Average number of F-actin patches per 10 µm inside the AIS. Medians are SVBP-KO 11.1, WT 7.5 and TTL-KO 7.6. For F–H, n=13, 36, 23 AIS for SVBP-KO (three independent cultures), WT (six independent cultures) and TTL-KO (three independent cultures). ns, non-significant (Mann–Whitney test). Error bars in B and C are mean±s.e.m.; error bars in G and H are median±95% c.i.

