Fig. 4.
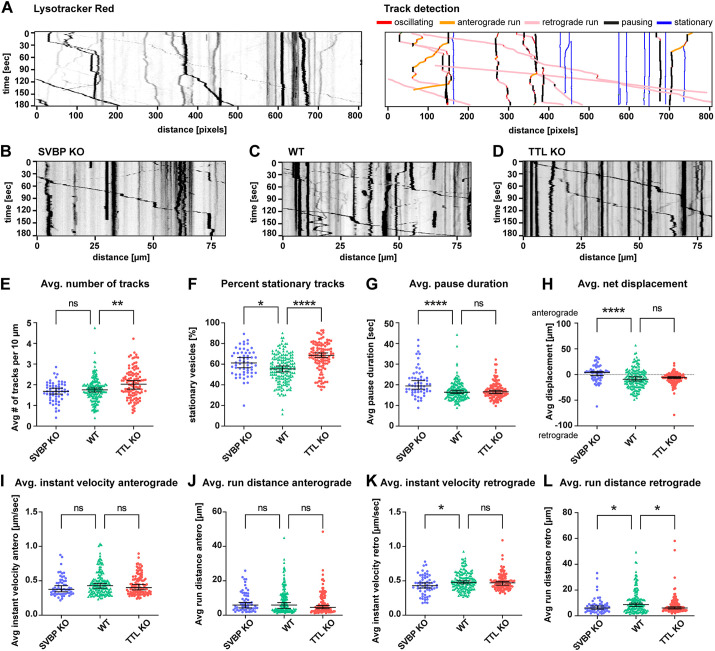
The retrograde trafficking efficiency of endolysosomes is similarly decreased in the distal axons of TTL-KO and SVBP-KO hippocampal neurons. (A) Left, representative kymograph from individual Lysotracker-treated axons; each trace represents a single organelle. Right, kymograph analysis presented on the left using a Python script (see Materials and Methods for details). (B–D) Representative example kymographs for SVBP-KO (B), WT (C) and TTL-KO neurons (D). See also Movies 1–3. (E–L) Summary of vesicle trafficking properties during the imaging period. (E) Average number of all detected vesicles per 10 µm (mobile and stationary). (F) Percentage of stationary vesicles. (G) Average pause duration. (H) Average net displacement in anterograde or retrograde direction. (I,J) Average anterograde instant velocities and run distances. (K,L) Average retrograde instant velocities and run distances. For E–L, individual values and median with 95% c.i. are shown. n=58, 164 and 114 axons from SVBP (three independent experiments), WT (six independent experiments) and TTL-KO (five independent experiments), respectively. ns, not significant; *P<0.05; **P<0.005; ****P<0.0001 (Kruskal–Wallis test with Dunn's multiple comparisons test).

