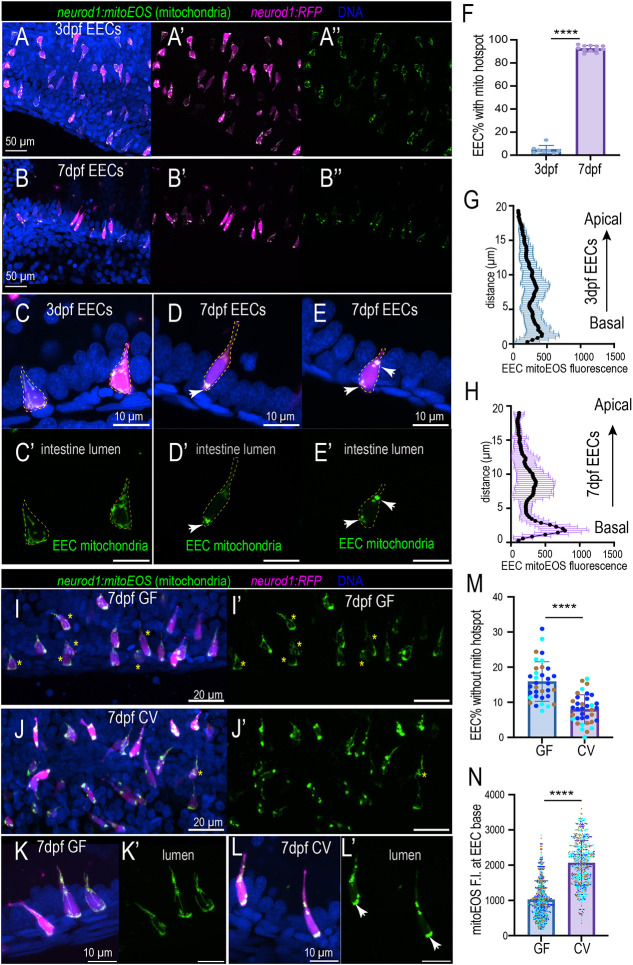
Fig. 4.
Commensal microbiota colonization promotes mitochondria accumulation at the EEC basal lateral membrane. (A-B″) Confocal projections of representative 3 dpf and 7 dpf zebrafish proximal intestine. The EECs were labeled via the neurod1:RFP transgene, and the EEC mitochondria were labeled via the neurod1:mitoEOS transgene. Mitochondria in 7 dpf EECs but not in 3 dpf EECs display a punctate distribution pattern. (C-E′) Magnification showing representative EECs in 3 dpf and 7 dpf zebrafish proximal intestine. Mitochondria are evenly distributed in 3 dpf but not 7 dpf EEC cytoplasm. White arrows indicate mitochondria hotspots at the EEC base and neck. Dashed yellow outlines indicate individual EECs. (F) Quantification of percentage of EECs displaying mitochondria hotspot pattern in 3 dpf and 7 dpf zebrafish proximal intestine. Each dot represents an individual zebrafish. (G,H) Quantification of mitochondrial distribution profiles in 3 dpf (G) and 7 dpf (H) zebrafish proximal intestinal EECs. Compared with 3 dpf zebrafish EECs, 7 dpf zebrafish EECs display higher mitochondrial contents at the EEC base: 36 EECs from five 3 dpf zebrafish and 36 EECs from five 7 dpf zebrafish were analyzed. (I-J′) Confocal projections of representative 7 dpf Tg(neurod1:mitoEOS); Tg(neurod1:RFP) GF and CV zebrafish proximal intestine. Asterisks indicate the EECs that display an even mitochondrial hotspot distribution pattern. (K-L′) Magnification showing representative EECs in 7 dpf GF and CV zebrafish proximal intestine. Mitochondria were evenly distributed within the GF EEC cytoplasm but displayed a hotspot pattern in CV EECs. White arrows indicate the mitochondrial hotspot at the EEC base. (M) Quantification of the percentage of EECs without basal mitochondrial hotspots in 7 dpf GF and CV zebrafish proximal intestine. Each dot represents an individual zebrafish. Zebrafish samples pooled from three independent derivation experiments were analyzed (samples from one derivation experiment are labeled by the same color): 3338 EECs from 36 CV zebrafish and 2697 EECs from 34 GF zebrafish were analyzed. (N) Quantification of the mitochondrial fluorescence intensity at the basal membrane in 7 dpf GF and CV zebrafish proximal intestine: 15 zebrafish from three independent derivation experiments were analyzed in each group, and >120 EECs from each zebrafish were analyzed. Each dot represents an individual EEC. The EECs from the same derivation experiments are labeled with the same color. Data are mean±s.d. ****P<0.0001 (unpaired, two-tailed Student's t-test). Scale bars: 50 μm (A,B); 10 μm (C-E′,K-L′); 20 μm (I-J′).

