Fig. 8.
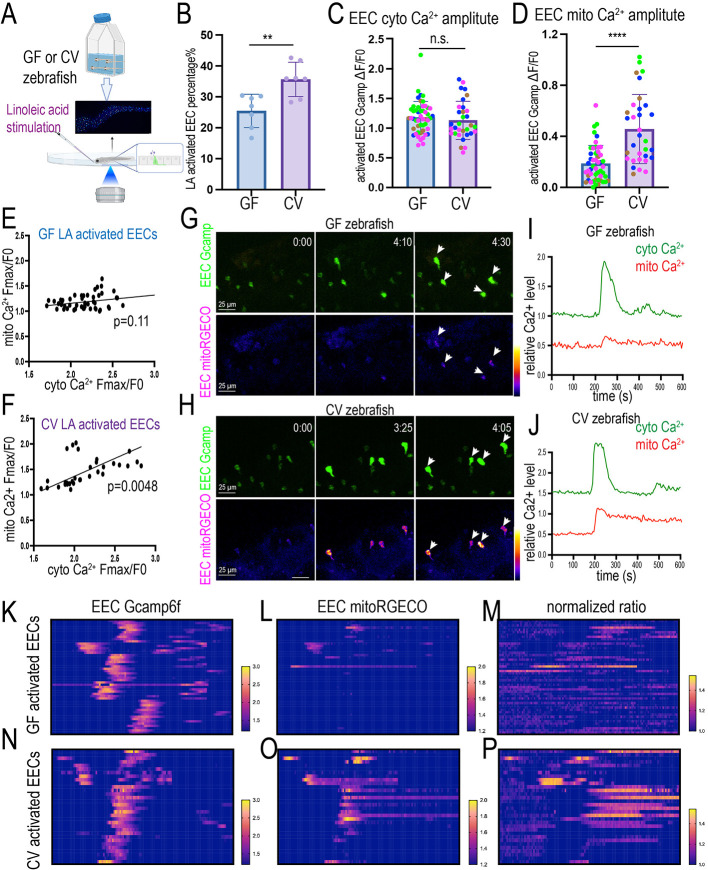
Nutrient-induced EEC mitochondrial Ca2+ increase requires commensal microbiota colonization. (A) Schematic showing in vivo imaging to analyze the 7 dpf GF and CV zebrafish EEC cytoplasm and mitochondrial activity in response to linoleic acid stimulation. (B) Quantification of linoleic acid-activated EEC percentage in GF and CV zebrafish. Each dot represents an individual zebrafish. (C,D) Quantification of the linoleic acid-activated EEC cytoplasmic Ca2+ amplitude (C) and the mitochondrial Ca2+ amplitude (D). Each dot represents an individual EEC. EECs from four GF and four CV zebrafish were analyzed. The EECs from the same GF or CV zebrafish are labeled with the same color. (E,F) Correlation between cytoplasmic Ca2+ amplification and mitochondrial Ca2+ amplification in GF (E) and CV (F) zebrafish EECs. (G,H) Time-lapse images of the representative EECs post linoleic acid stimulation in GF (G) and CV (H) zebrafish. The EEC cytoplasmic Ca2+ was labeled by Gcamp6f and the EEC mitochondrial Ca2+ was labeled by mitoRGECO. (I,J) Analysis of fluorescence change of Gcamp and mitoRGECO in representative linoleic acid-activated GF (I) and CV (J) EECs. (K-P) Analysis of the change of the EEC Gcamp6f fluorescence (K,N), EEC mitoRGECO fluorescence (L,O) and EEC mitoRGECO/Gcamp6f ratio (M,P) in GF and CV zebrafish. Only the linoleic acid-activated EECs were plotted. Analysis of 32 activated EECs from four CV zebrafish and 50 activated EECs from four GF zebrafish. A second independent derivation experiment was performed in which seven GF zebrafish and seven CV zebrafish were analyzed, and the same conclusion was reached for all data presented in this figure. Data are mean±s.d. **P<0.01, ****P<0.0001 (unpaired, two-tailed Student's t-test). n.s., not significant. Scale bars: 25 μm.

