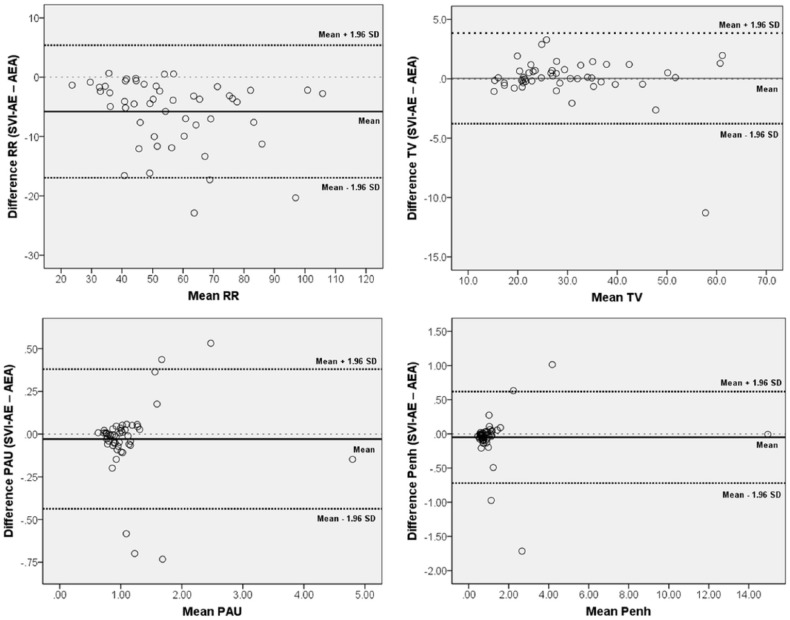
Figure 2.
Bland–Altman plots of respiratory rate (RR), tidal volume (TV), pause (PAU) and enhanced pause (Penh). The mean differences between data obtained from the simultaneous visual inspection plus automatic elimination (SVI-AE) and automatic elimination alone (AEA) methods are shown in each plot. Limits of agreement are the mean ± 1.96 SD

