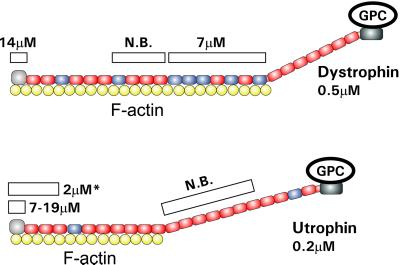
Figure 7.
Side binding model for dystrophin and utrophin binding to actin filaments. Shown are schematic diagrams of dystrophin and utrophin complexed with F-actin. Red spectrin-like repeats are acidic, and blue repeats are basic. The white bars above dystrophin and utrophin represent the recombinant fragments for each protein that have been analyzed for actin binding activity with the measured affinities indicated. N.B., no binding observed. The fragment marked with an asterisk was described in Zuellig et al. (2000).

