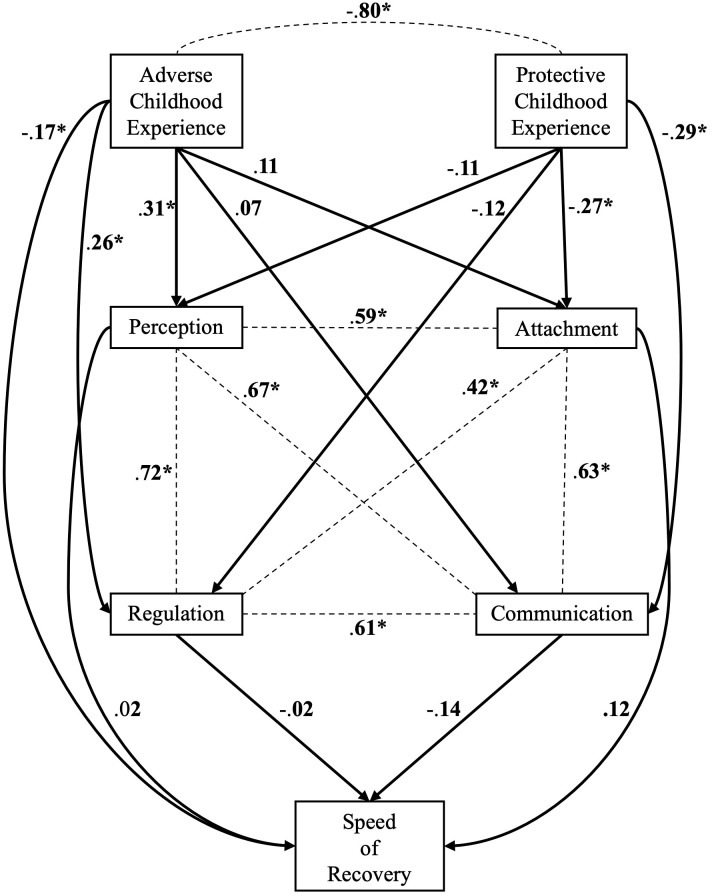
Figure 2.
Model B. To achieve readability we omitted all disturbances, variances and all paths connected to the covariates; we only visualized the path corresponding to our hypotheses. The omitted path can be seen in Table 5 . Dotted Lines represent correlations and arrows represent direct effects. Standardized values are shown. * p <.05.

