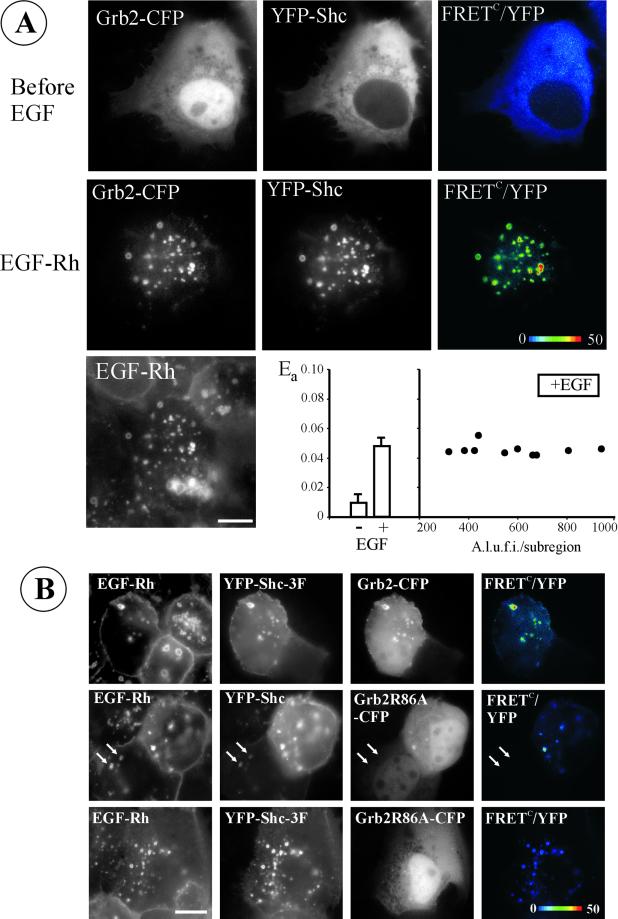
Figure 1.
Interaction of Grb2-CFP and YFP-Shc in endosomes induced by EGF. (A) Grb2-CFP and Shc-YFP were transiently expressed in A-431 cells. YFP, CFP, and FRET images were acquired before and after incubation of cells with 200 ng/ml EGF-Rh for 20 min at 37°C. EGF-Rh was detected using Cy3 filter channel. FRETC was calculated as described in MATERIALS AND METHODS, and is presented as pseudocolor intensity-modulated image (FRETC/YFP). Bar, 10 μm. On the graph, the apparent efficiencies of energy transfer between Grb2-CFP and YFP-Shc, Ea, calculated for multiple subregions of the images are shown. Left, averaged values of Ea are presented. Right, Ea values obtained for individual endosomes were plotted against mean intensities of YFP in each endosome. A.l.u.f.i., arbitrary linear units of fluorescence intensity. (B) Wild-type YFP-Shc and mutant YFP-Shc-3F (Y239F, Y240F, and Y317F mutations) were coexpressed with Grb2-CFP or Grb2R86A-CFP mutant in A-431 cells. The incubation with EGF-Rh and FRET imaging was performed as described in A. Arrows point to an example of the endosomes that contain EGF-Rh and YFP-Shc but lack Grb2R86A-CFP in the cell that expresses low levels of YFP-Shc. Bar, 10 μm.

