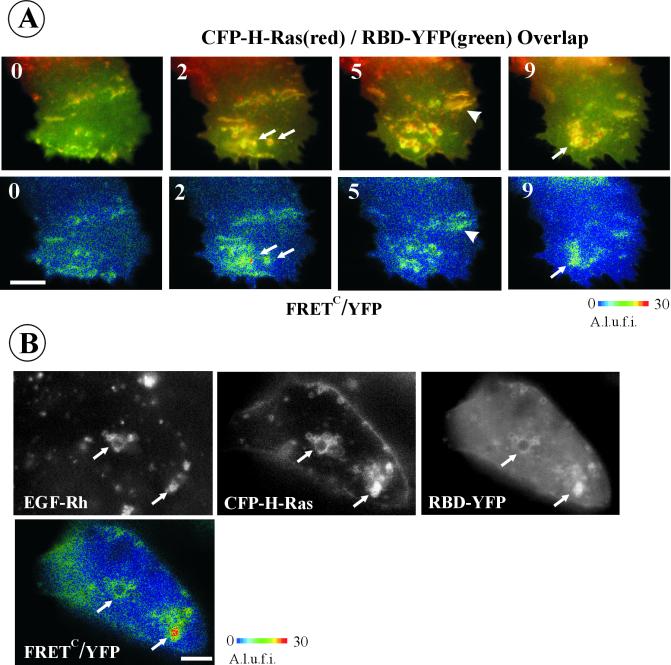
Figure 8.
Localization of GTP-bound H-Ras in EGF-stimulated cells. (A) CFP-H-Ras was coexpressed with RBD-YFP in A-431 cells. Cells were grown on the microscopy chamber. YFP, CFP, and FRET images were acquired from the same cell before and after 2-, 5-, and 9-min incubation of the cells with 200 ng/ml EGF at 37°C. FRETC images were calculated as described in MATERIALS AND METHODS, and is presented as pseudocolor intensity-modulated images (FRETC/YFP). Arrows point to membrane structures with the typical shape of endosomal compartments. Arrowheads point on plasma membrane ruffles. A.l.u.f.i., arbitrary linear units of fluorescence intensity. Bar, 5 μm. (B) A-431 cells expressing CFP-H-Ras and RBD-YFP were stimulated with 200 ng/ml EGF-Rh for 15 min at 37°C. YFP, CFP, and FRET images were acquired at room temperature, FRETC were calculated and presented as YFP intensity-modulated images (FRETC/YFP). EGF-Rh was detected through Cy3 filter channel. Arrows point to examples of colocalization of FRETC and EGF-Rh signals in endosomal compartments. A.l.u.f.i., arbitrary linear units of fluorescence intensity. Bar, 5 μm.

