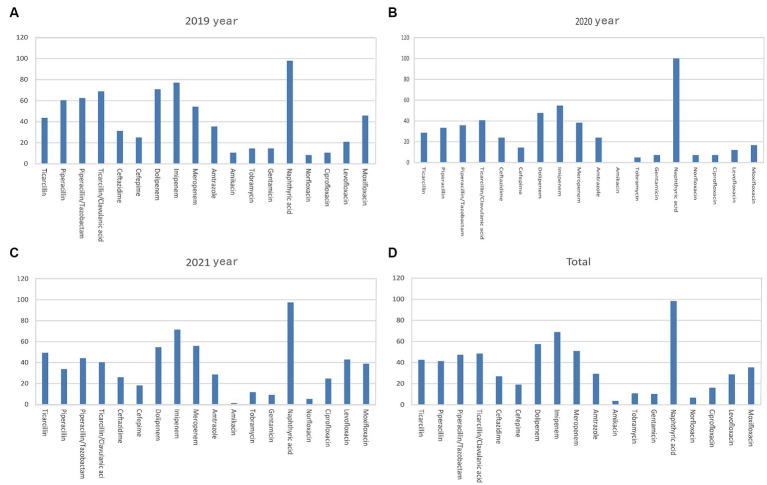
Figure 4.
Analysis of the rates of non-fermenting bacterial drug resistance. Rates of Pseudomonas aeruginosa drug resistance in (A) 2019, (B) 2020, (C) 2021, and (D) 2019–2021. The X-axis of all the graphs displays antimicrobial agents, while the Y-axis represents the percentage proportions of resistant bacteria strains.

