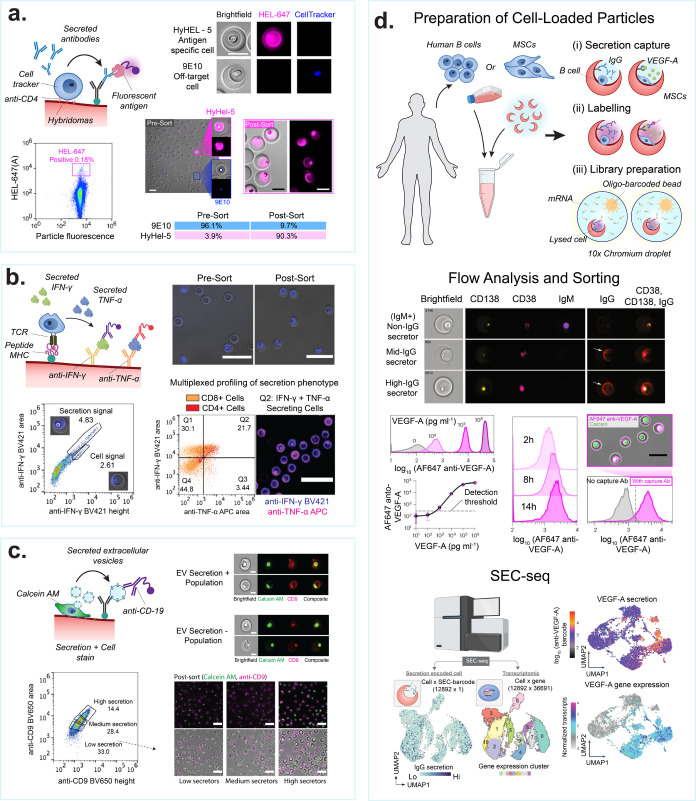
Figure 4.
Screening secreted cellular products on nanovials. (a) Antibody secretions can be captured from hybridoma lines, producer cell lines, and primary antibody-secreting B cells. Schematic shows cells are captured, e.g., with antibodies specific to cell surface markers, and secreted antibodies are captured onto antigens or antibodies on the nanovial surface. Images show antigen-specific IgG bound on nanovials (magenta) secreted by HyHEL-5 cells, while 9E10 cells secreting an off-target IgG (blue) do not have corresponding signal on nanovials. Flow scatter plot highlighting the gate used to sort antigen-specific IgG secretors. Presort and postsort microscopy images are shown. The table shows sort enrichment of spiked HyHEL-5 cells. Scale bars are 100 μm. [Reproduced from de Rutte, J., et al. Suspendable Hydrogel Nanovials for Massively Parallel Single-Cell Functional Analysis and Sorting. ACS Nano2022, 16 (5), 7242–7257 (ref (11)). Copyright 2022 American Chemical Society.] (b) Schematic showing multiple cytokines can be captured in parallel from activated T cells that are engaged through TCR interactions with peptides loaded onto class I major histocompatibility complex (p-MHC). Images and FACS plots show T cells captured using p-MHC and screened for IFNγ and TNFα production. Fluorescence peak area vs height scatter plots showing gates used to differentiate nanovial staining vs cell staining of permeabilized cells. Scale bars are 100 μm. [Reprinted with permission from ref (95). Copyright, 2022 D. Koo.] (c) MSCs are captured based on binding to gelatin on nanovials and screened based on extracellular vesicle secretion. Scale bars are 20 μm (top) and 100 μm (bottom). [Reprinted with permission from ref (27). Copyright, 2023 D. Koo.] Imaging flow cytometry of MSCs and captured EVs, stained with an antibody against the tetraspanin, CD9 (red), showing EV secretion positive and negative populations. The viability dye, calcein AM, is used to stain live cells (green). Bottom panel images show calcein AM-stained MSCs (green) on nanovials stained with anti-CD9 (magenta) following FACS sorting based on EV-specific secretion signal gates (low, medium, high secretors). (d) Secretion is associated with single-cell RNA sequencing data (SEC-seq) by using oligo-barcoded detection antibodies and droplet single-cell barcoding of cDNA libraries. Imaging flow cytometry of nonsecreting and IgG-secreting cells. Flow cytometry histograms of VEGF-A signal on nanovials from a VEGF-A concentration sweep or signal from secreting cells over time. Signal is dependent on the presence of a VEGF-A capture antibody. Scale bar is 50 μm. [Reprinted with permission from Macmillan Publishers Ltd.: Nature, Udani, S., et al. Nat. Nanotechnol. (ref (9)). Copyright 2023.] SEC-seq data shows transcriptome-based clustering of single-cell expression profiles and corresponding IgG or VEGF-A secretion signal. [Reprinted with permission from Macmillan Publishers Ltd.: Nature, Cheng, R., et al. Nat. Commun. (ref (26)) Copyright 2023.]

