Figure 6.
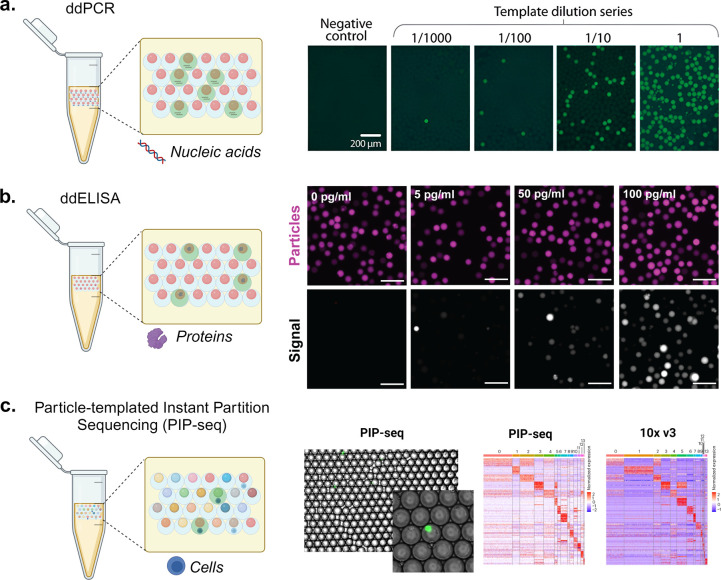
Molecular and cellular assays using particle-templated emulsions. (a) Using PTEs to perform droplet digital PCR (ddPCR). The schematic shows droplets positive (green fluorescence) and negative (no fluorescence) for nucleic acid amplification using ddPCR. The fluorescence microscopy images show the amplification of yeast genomic DNA at varying dilutions in a digital regime where the fractions of positive droplets (with fluorescence) correspond with the DNA concentration. Scale bars are 200 μm. [Reproduced from Hatori, M., et al. Particle-Templated Emulsification for Microfluidics-Free Digital Biology. Anal. Chem.2018, 90 (16), 9813–9820 (ref (28)) Copyright 2018 American Chemical Society.] (b) Using PTE to perform ddELISA. The schematic shows droplets positive (green fluorescence) and negative (no fluorescence) for analyte binding and enzymatic amplification using ddELISA. The fluorescence microscopy images illustrate particles (magenta) and fluorescence signal from enzymatic turnover (grayscale) where an increasing fraction of positive droplets corresponds with an increasing concentration of a heart failure protein biomarker. Scale bars are 100 μm. [Reprinted with permission from ref (119). Copyright, 2023 V. Shah.] (c) Using PTE to perform single-cell RNA sequencing. The schematic illustrates coencapsulation of particles and cells in droplets, where color indicates different oligonucleotide barcodes on particles. Similar cell clustering and marker genes are observed for PIP-seq compared to 10X Chromium V3 workflows for cells from healthy breast tissue. [Reprinted with permission from Macmillan Publishers Ltd.: Nature, Clark, I. C., et al. Nat Biotechnol.2023, 41 (11), 1557–1566 (ref (31)). Copyright 2023.]

