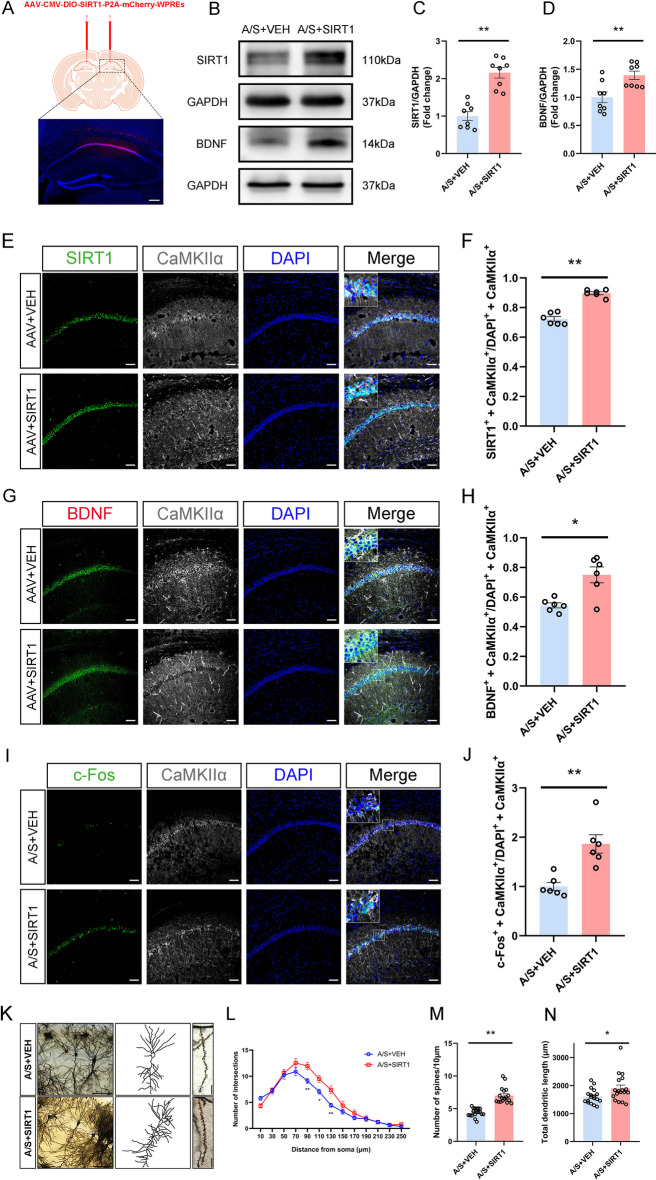
Fig. 5.
Effects of SIRT1 overexpression in hippocampal CA1 glutamatergic neurons on SIRT1/BDNF expression, synaptic plasticity and neuronal excitability. A Fluorescence images showed that the AAV-SIRT1 vector was effectively expressed in the CA1 region of the hippocampus. B Representative Western blot protein bands. C Quantitative results show that the level of SIRT1 in the hippocampal CA1 region of SIRT1-overexpression mice was increased **p < 0.01 (n = 8). SIRT1 expression in each sample was normalized to that of GAPDH. The SIRT1 level of control mice was set to 1 for quantification. D Quantitative results show that the level of BDNF in the hippocampal CA1 region of SIRT1-overexpression mice was increased **p < 0.01 (n = 8). BDNF expression in each sample was normalized to that of GAPDH. The BDNF level of control mice was set to 1 for quantification. E Representative images of SIRT1 and CaMKIIα. Scale bar, 100 μm. F Quantitation of the co-labeling rate of SIRT1 and CaMKIIα **p < 0.01 (n = 6). G Representative images of BDNF and CaMKIIα. Scale bar, 100 μm. H Quantitation of the co-labeling rate of BDNF and CaMKIIα *p < 0.05 (n = 6). I Representative images of c-Fos and CaMKIIα. Scale bar, 100 μm. J Quantitation of the co-labeling rate of c-Fos and CaMKIIα **p < 0.01 (n = 6). K Profile images of Golgi staining of neurons in the hippocampal CA1 region. 20 × with camera tracings and 60 × for spine counting. Scale bar, 100 μm for 20 ×; 10 μm for 60 ×. L Quantification of dendritic bifurcations *p < 0.05, **p < 0.01 (n = 18). M Quantitation of the dendritic spine density **p < 0.01 (n = 18). N Quantitation of the total dendritic length *p < 0.05 (n = 18)

