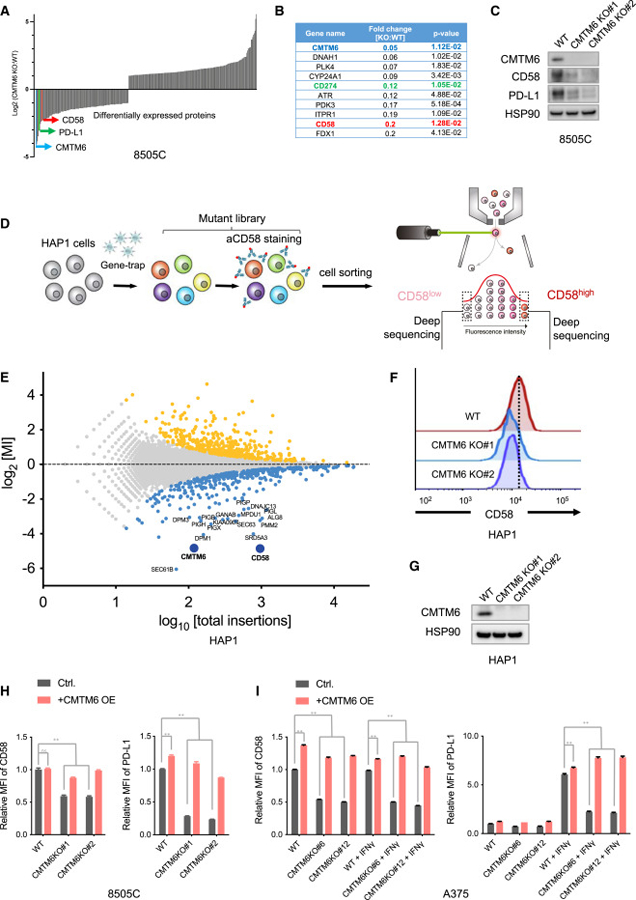
Figure 1. Identification of CMTM6 as a positive modulator of CD58.

(A) Quantitative proteomics analysis of CMTM6-proficient (WT) and -deficient (KO) 8505C cells. Fold changes of significantly differentially expressed proteins (two-sided Student’s t test, p < 0.05) are depicted.
(B) List of top 10 downregulated proteins in CMTM6-deficient 8505C cells.
(C) Western blot analysis of CMTM6, CD58, and PD-L1 expression in parental 8505C cells (WT) and independent CMTM6-knockout clonal cells (CMTM6 KO). HSP90 served as a control.
(D) Schematic illustration of the flow cytometry-based haploid genetic screen for modulators of CD58 expression.
(E) Identification of modulators of CD58 expression by the haploid genetic screen depicted in (D). Each dot represents an individual gene, with the x axis indicating the number of disruptive insertions in each gene, and the y axis showing the fold changes in the frequency of unique insertions in the CD58high population compared to the CD58low population. Genes with a significant enrichment of insertions (two-sided Fisher’s exact test, FDR-corrected p < 0.05) in either the CD58high or CD58low populations are represented by light orange and blue dots, respectively.
(F and G) CD58 expression levels in parental HAP1 cells (WT) and independent CMTM6-knockout clonal cells (CMTM6 KO). Levels of CD58 expression were determined by flow cytometry (F) and CMTM6 expression was analyzed by Western blot (G). HSP90 served as a control in the Western blot analysis.
(H and I) Flow cytometry analysis of CD58 and PD-L1 expression in wild-type (WT), CMTM6-knockout (CMTM6 KO), CMTM6-overexpressing (WT + CMTM6 OE), and CMTM6-reconstituted (CMTM6 KO + CMTM6 OE) 8505C (H) and A375 cells with or without IFNγ exposure (I). Data represent the mean ± standard deviation of triplicates and were analyzed using a two-way ANOVA test (with Tukey’s multiple comparisons test). A p value greater than 0.05 indicates non-significance (ns), while a p value less than 0.0001 is denoted as **.
