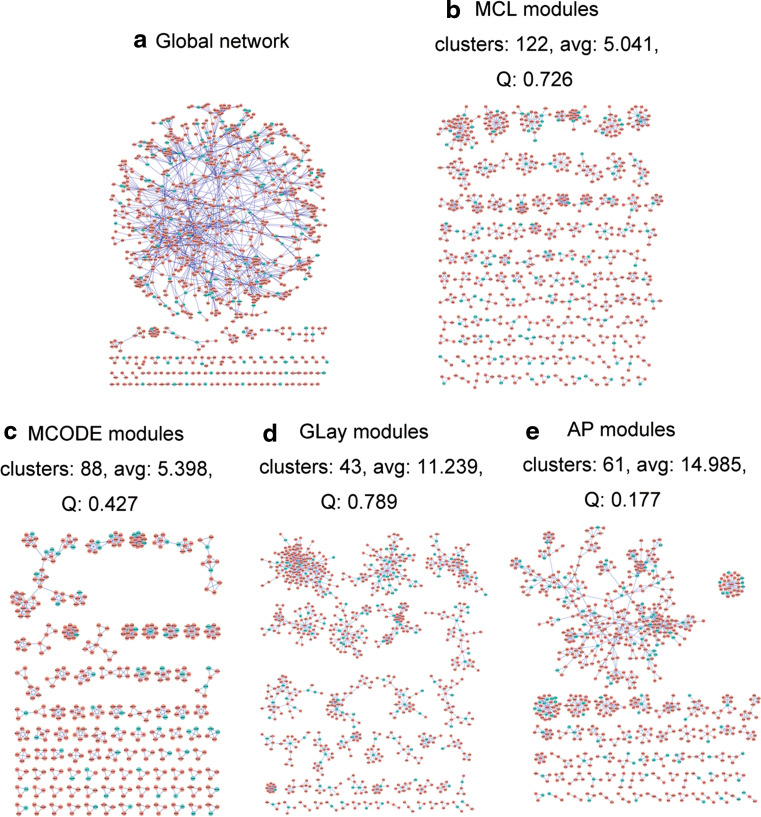
Fig. 1.
Graphical representation of the global network and comparison of MCL, MCODE, GLay, and affinity propagation results. a The global network containing 258 stroke-associated genes downloaded from the OMIM. The blue-green nodes denote the 258 genes we entered. Average size (avg), modularity (Q), affinity propagation (AP). b 122 functional modules identified by MCL (size ≥3), average size: 5.041, maximum size: 45, minimum size: 3, modularity: 0.726. c 88 functional modules identified by MCODE, average size: 5.398, maximum size: 51, minimum size: 3, modularity: 0.427. d 43 functional modules identified by GLay (size ≥3), average size: 11.239, maximum size: 146, minimum size: 3, modularity: 0.789. e 61 functional modules identified by affinity propagation (size ≥3), average size: 14.985, maximum size: 681, minimum size: 3, modularity: 0.177

