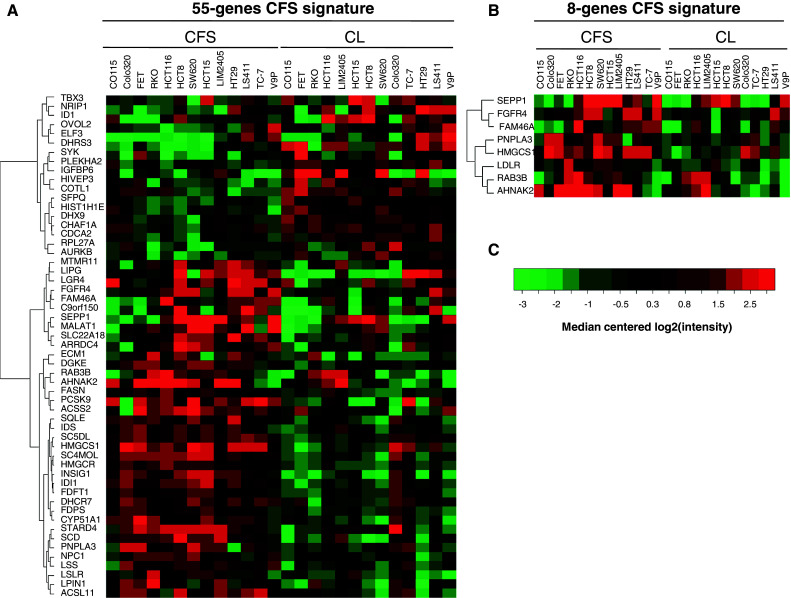
Fig. 6.

Heatmaps of the 55-gene (a) and 8-gene signatures (b). Visualization of the expression level for each gene in each sample relative to the median gene intensity (c) across all samples. Green corresponds to down-regulation and red to up-regulation. CL parental CRC cell line
