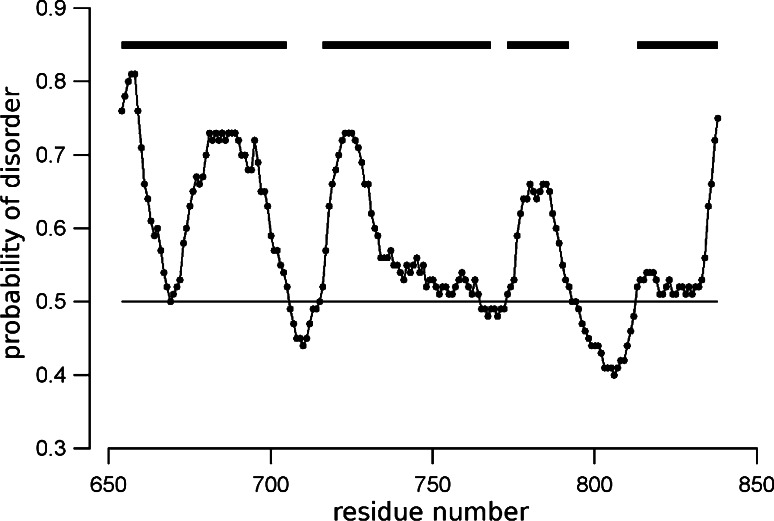
Fig. 1.
Primary structure analysis of CFTR-RD metaPrDOS prediction of local disorder as a function of residue number. The disordered regions are marked as horizontal lines. The threshold of 0.5 for the probability of disorder shown in the figure was defined to obtain a false-positive prediction rate <5 % (ROC = 0.904)

