Fig. 4.
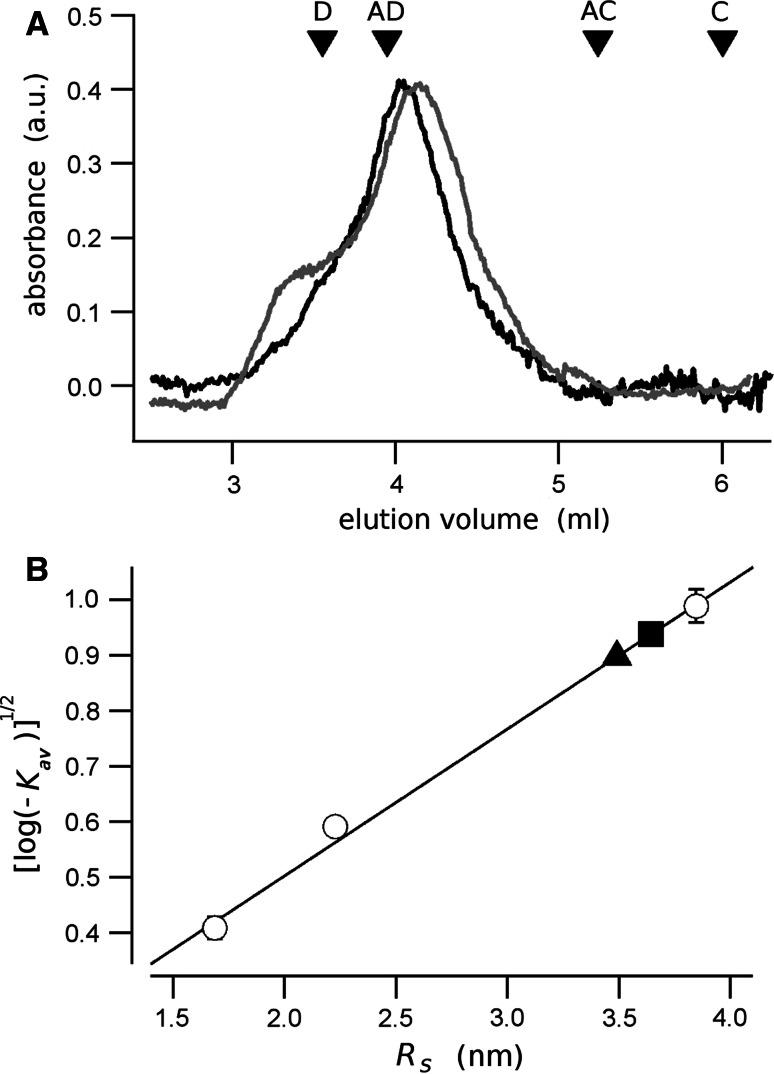
Size exclusion chromatography of the CFTR-RD. a The chromatogram of the native (black line) and the phosphorylated (gray line) RD. The molecular mass standards are shown as inverted triangles; D dextran blue, AD alcohol dehydrogenase, AC carbonic anhydrase, C cytochrome-C. b The square root of the partition coefficient, K av, is plotted against the Strokes radius, R S. The calibration points are indicated as open circles. The native and the phosphorylated RD are represented by a square and a triangle, respectively

