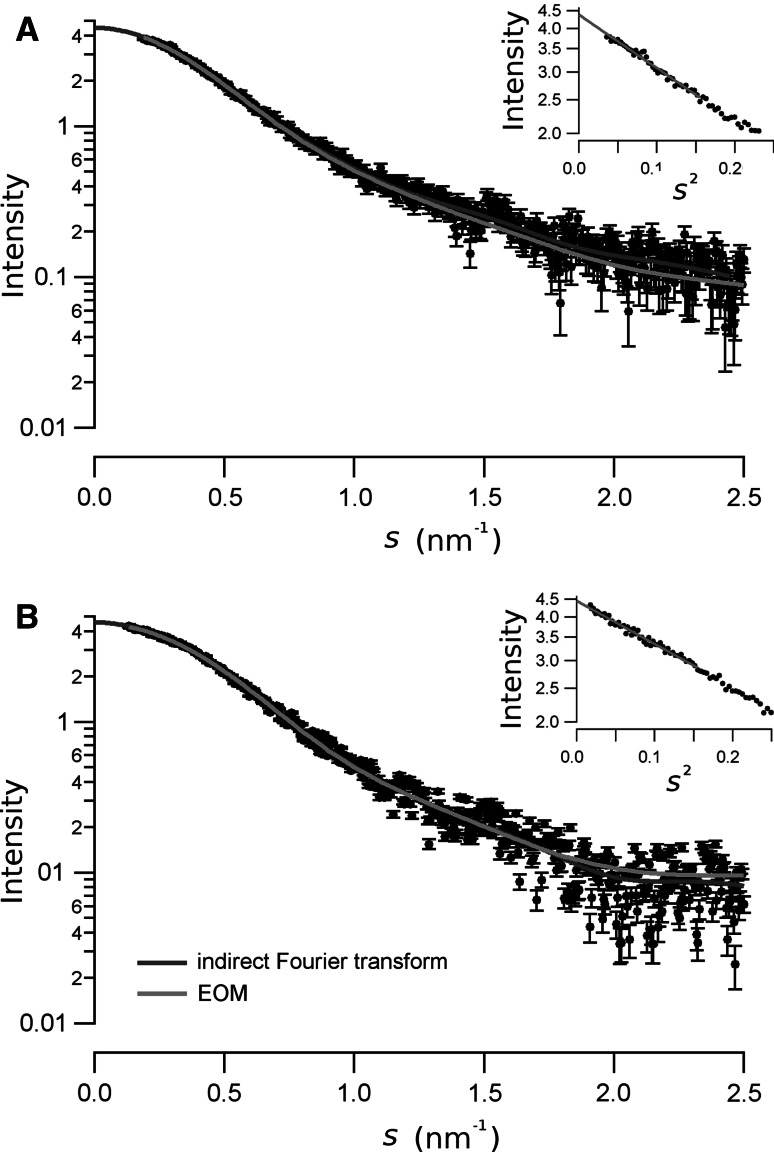
Fig. 5.
The experimental X-ray scattering data fort the native (a) and the phosphorylated (b) RD are shown as circles. Bars represent the standard deviation of the measurement. The continuous dark-gray lines are the scattering curve calculated from the inverse Fourier transform in Fig. 6. The light-gray line is the scattering curve calculated from the best optimization obtained from the EOM analysis. The Guinier plot for each conformation is shown as an inset

